
Toward a More Inclusive Economy
I thank Doris Carson Williams and the members of the African American Chamber of Commerce of Western Pennsylvania for the opportunity to speak with you today. As you may know, Doris is a member of the board of directors of the Federal Reserve Bank of Cleveland. In the best of times, the valuable insights provided by Doris, her fellow directors, and all of our contacts help us assess economic conditions and formulate monetary policy. But these are not the best of times. And I cannot overstate the importance of the information that Doris and our other contacts are providing – real-time, on-the-ground reconnaissance on how businesses and households are faring during the evolving pandemic. While the outlook remains uncertain, one thing I am certain of is that we have a better understanding of the economic impacts of the pandemic because of the public service of our directors and contacts. So, thank you, Doris.
It is clear that the adverse effects of the pandemic have not been evenly distributed. They have been borne by the most vulnerable in our economy: lower-income and minority workers and communities; those who do not have the opportunity to work from home; those who do not live in areas with reliable telecommunications and internet services or access to adequate healthcare; and the smaller of small businesses.1 Indeed, the results from a recent Fed survey show that between March and July, a larger percentage of low-income workers, less educated workers, and Black and Hispanic workers were laid off compared to higher-income, more educated, and white workers. Rehiring by employers has been slower for lower-income workers than for higher-income workers.2 In addition, from February to April, the number of active small business owners dropped by 3.3 million, a record 22 percent decline.3 Compared to small firms overall, Black-owned businesses have been twice as likely to close and Hispanic-owned businesses have been one-and-a-half times as likely to close. It is distressing to see the disparate impact of the pandemic, but the differences in economic outcomes did not start with COVID-19. There were already long-standing economic disparities in our economy.
In my remarks today, I will step back from the effects of the pandemic per se and examine the differences in economic opportunity that so many in America still experience at every phase of their lives. I will conclude with some thoughts, based on the research, on where we might focus in order to reduce these gaps and promote economic inclusion. As always, the views I will present are my own and not necessarily those of the Federal Reserve System or of my colleagues on the Federal Open Market Committee.
Why Economic Inclusion Matters
The Federal Reserve System's mission is to promote a healthy economy and stable financial system in the United States. Our monetary policy decisions, our actions as supervisors and regulators of banks, our role in the payments system, and our efforts to promote community development in low- and moderate-income areas all contribute to achieving a well-functioning economy and financial system in which everyone can participate. Opportunity and inclusion are important for achieving a strong economy, and the recently announced revision to the Fed's strategy for setting monetary policy explicitly states that we view maximum employment, one part of our statutory mandate, as a broad-based and inclusive goal.
Unfortunately, today, the U.S. economy does not offer the same opportunities to all. There are racial disparities in educational attainment, labor market outcomes, and access to credit. People born into areas of concentrated poverty or predominantly minority areas are disadvantaged over their entire lifetimes, and so are their children. Unless actions are taken to promote an inclusive economy – one in which people have the chance to move themselves and their families out of poverty, one in which systemic racism does not limit opportunities, and one in which all people can fully participate – the U.S. economy will not be able to live up to its full potential and the country will suffer.
Upward Mobility
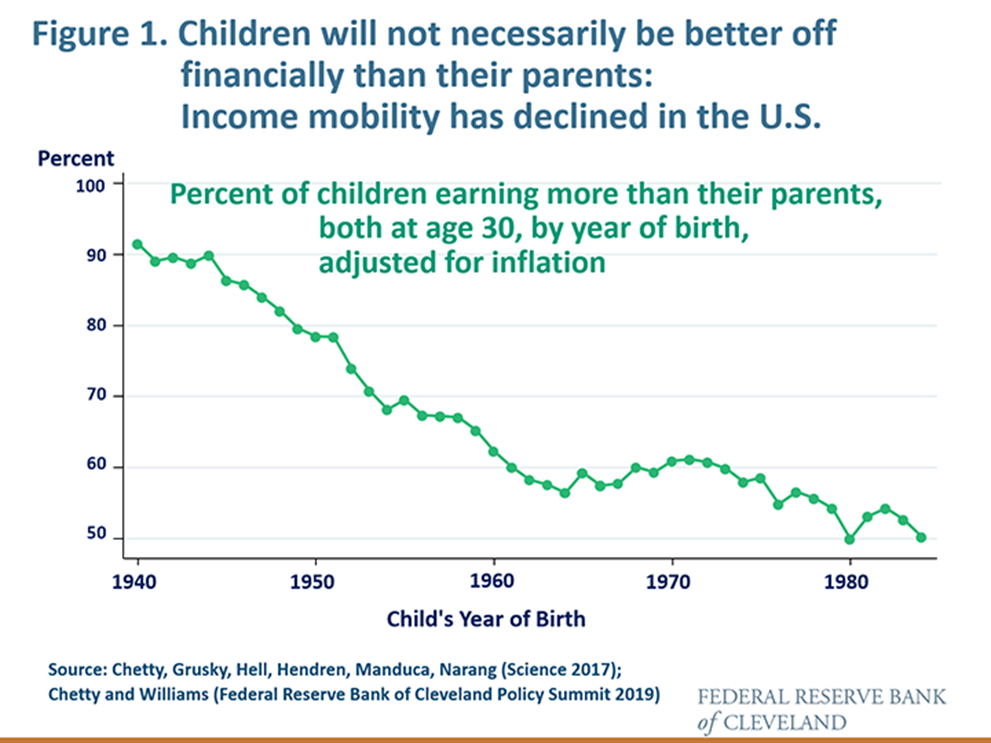
[FIGURE 1] All parents want to know that their children will be better off financially than they are. An important part of the American Dream is the idea that anyone can climb up the ladder through hard work and perseverance. But upward mobility – the probability that a child will be better off economically than his or her parents – has fallen sharply in the U.S. since World War II. At last year's Cleveland Fed Policy Summit, Harvard professor Raj Chetty presented some of his seminal research on income mobility.4 Around 90 percent of children born in 1940 earned more at age 30 than their parents did.5 By the mid-1980s, only about 50 percent did. And, although not shown in the figure, the largest declines have been in the middle class.
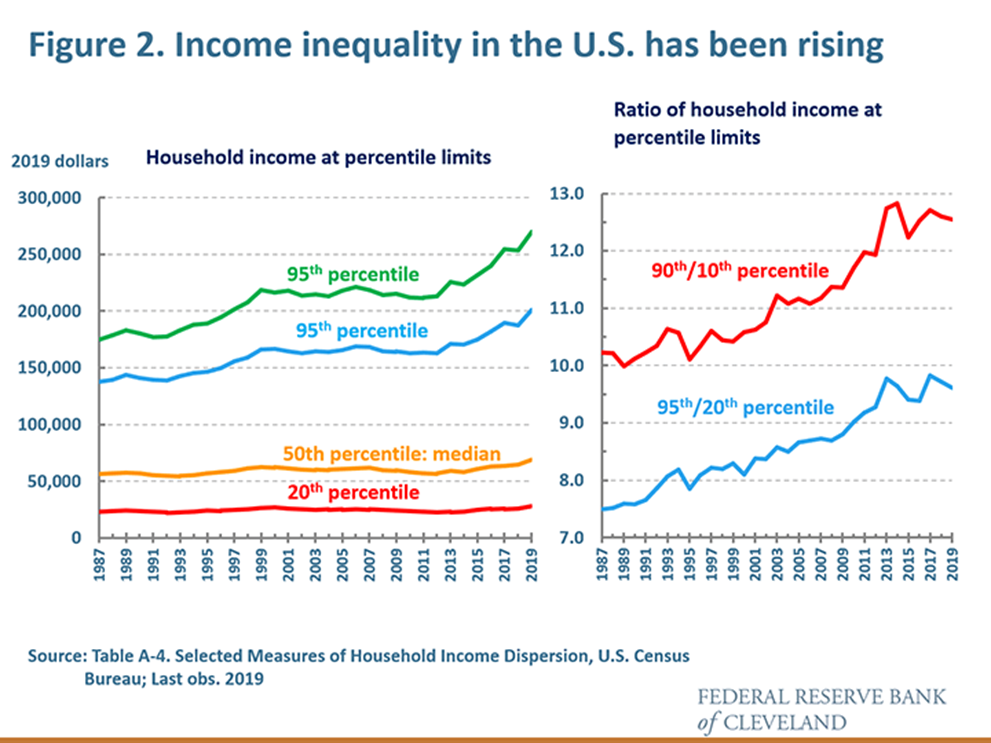
[FIGURE 2] Many factors have contributed to this decline. One contributor is rising income inequality, which leads to advantages in terms of education and other social factors for those in the higher-income groups compared to those in the bottom. Since the 1960s, the median level of income, adjusted for inflation, has risen over time, from about $48,000 in 1967 to about $69,000 in 2019. But those in the top 10 percent of the income distribution have enjoyed sharper gains than those in the bottom 10 percent. The U.S. has one of the lowest rates of intergenerational mobility among advanced economies and more pronounced income inequality.6
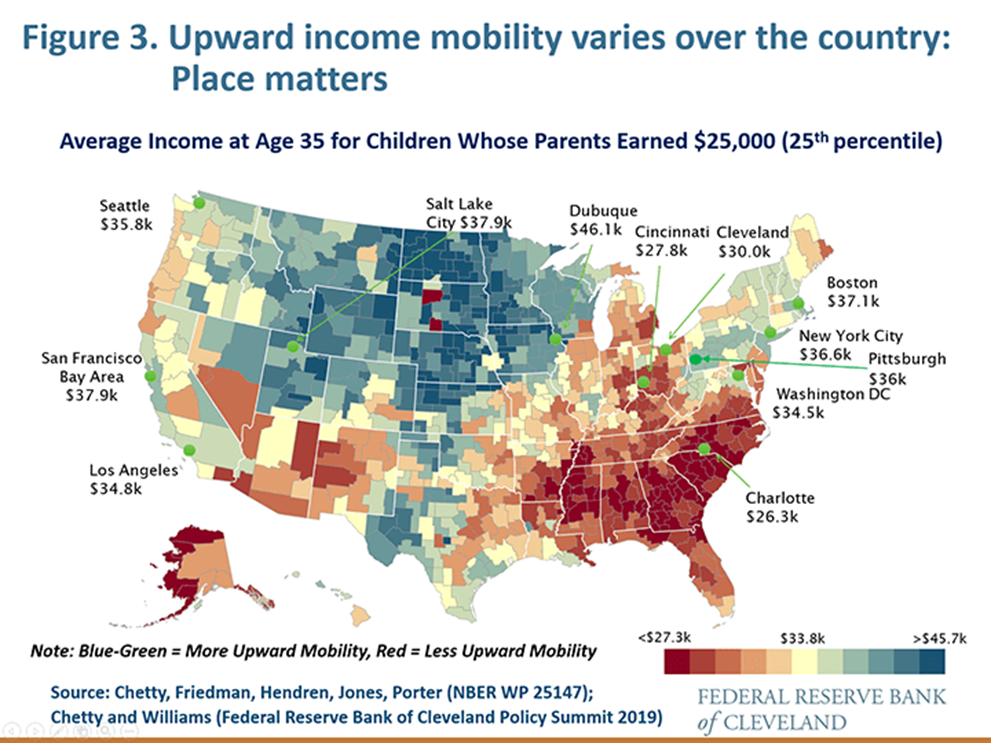
[FIGURE 3] To get the full picture, we need to look at disaggregated data.7 Research by Chetty and his co-authors shows that upward mobility depends not only on the family's characteristics but also on neighborhood characteristics such as neighborhood income, racial integration, the quality of schools, and access to social services.8 On this map, areas of relatively high intergenerational mobility are shown in shades of blue-green. Children who grew up in these places earn higher average income in their mid-thirties than their parents did at the same age. Shades of red indicate areas of low intergenerational mobility: places where children have not progressed very far in terms of income relative to their parents. An important insight is that even areas with fairly good economies in terms of stronger output growth and job growth, like some places in the South, have not necessarily produced high levels of upward mobility for the children growing up there. Strong economic factors certainly help, but they are not a panacea.
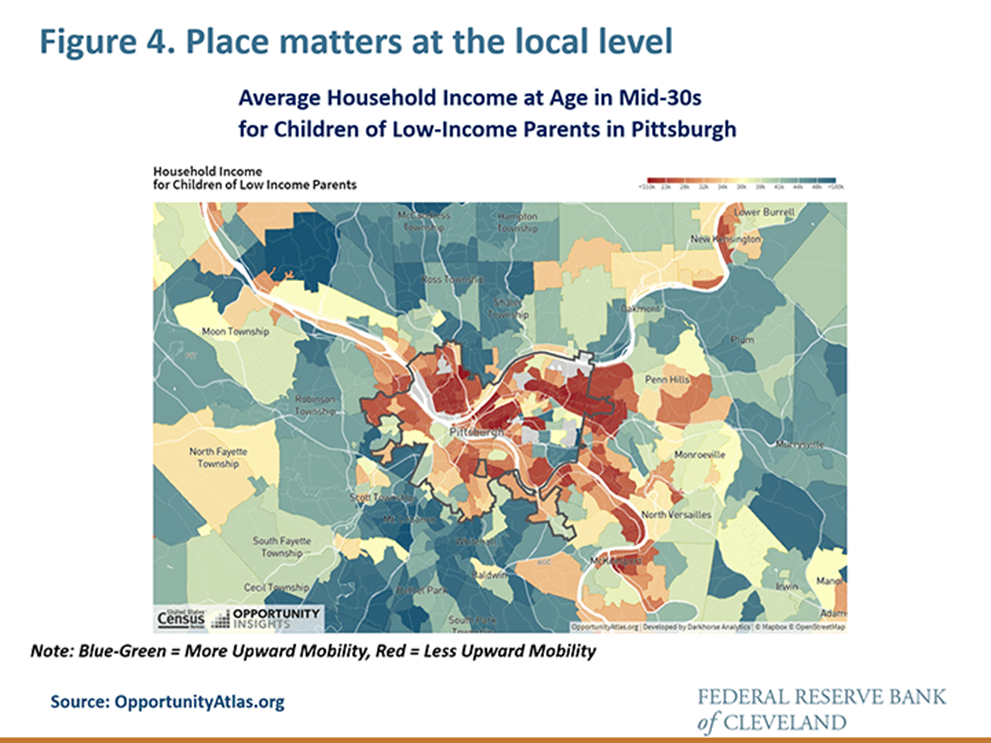
[FIGURE 4] In Pittsburgh, mobility differs quite a bit across the city, and if you were to drill down even further, you would see differences even within neighborhoods.
In fact, research shows that moving a child from a low-mobility neighborhood to a high-mobility neighborhood can have profound effects on his or her future economic outcomes.9 This is true not only in the U.S., but also in countries, like Australia, where income inequality is lower than it is here.10
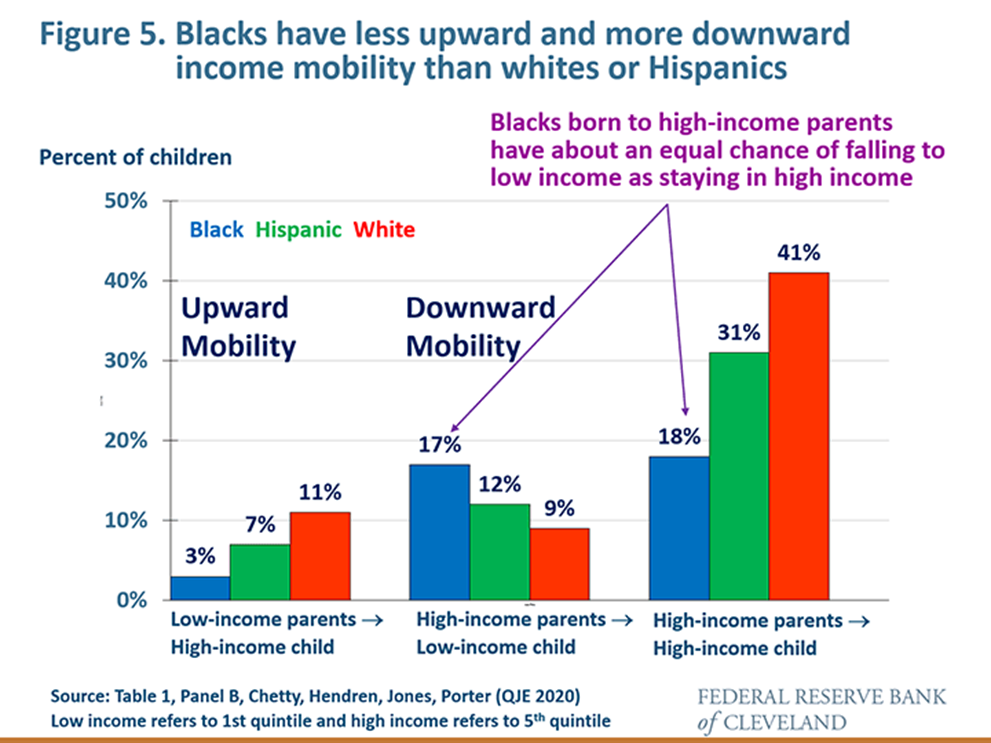
So place matters. But so does race. Research by Chetty and co-authors has found that there is a gap in earnings between Black males and white males even if their parents were at the same income level and they grew up in the same neighborhood.11
[FIGURE 5] The research also shows that even conditional on where a child grows up, Blacks have a significantly lower chance of moving up in the income distribution than whites or Hispanics and a higher chance of moving down in the distribution. Strikingly, Blacks who happen to have been born to parents in the highest income quintile are almost as likely to move down to the lowest quintile as to stay in the highest one.
Gaps in Income and Net Worth
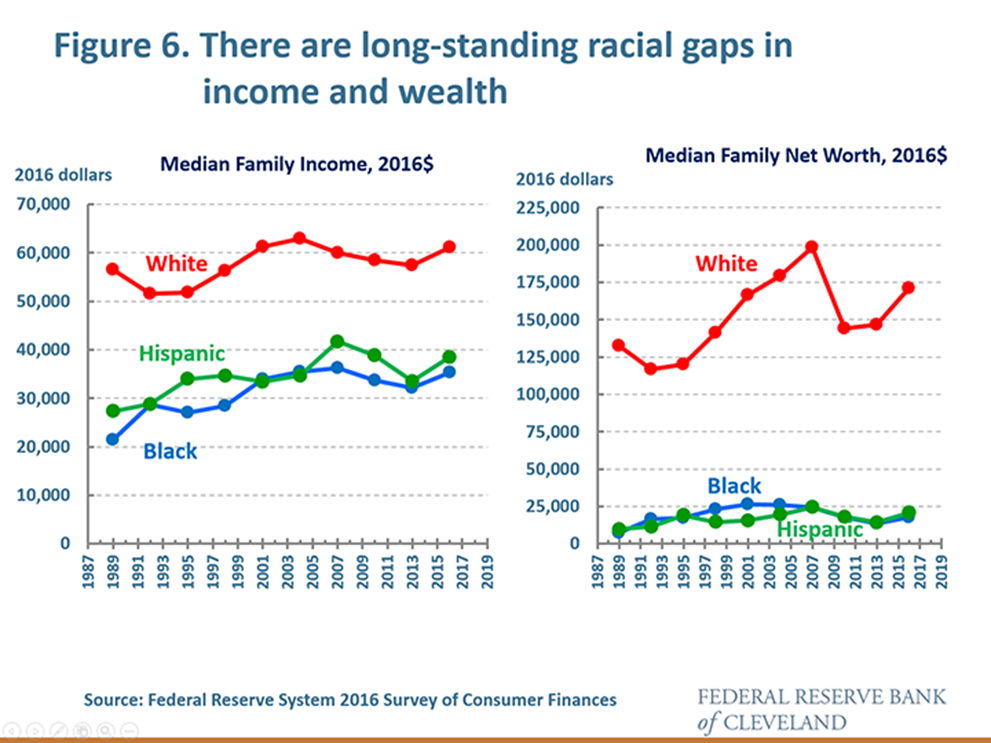
[FIGURE 6] According to the most recent Federal Reserve triennial Survey of Consumer Finances, in 2016, median income for white households was about 1-3/4 times that of Black families and 1-1/2 times that of Hispanic families.12 Earnings are an important driver of family net worth (financial and nonfinancial assets, like homes and autos, minus debt).13 Racial gaps in net worth are much larger than income gaps: the median net worth of white families in 2016 was almost 10 times as high as that of Black families and about 8 times as high as that of Hispanic families.14 These gaps are not a recent phenomenon: they have been around for decades.
Gaps over the Life Cycle: Early Years
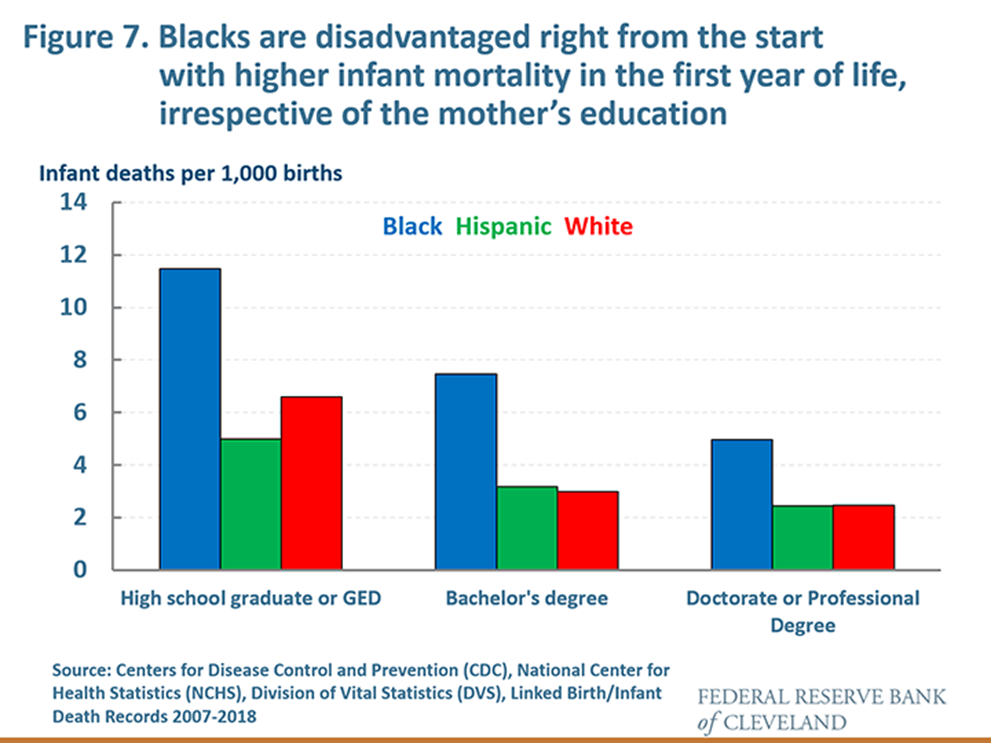
[FIGURE7]Many factors play a role in these gaps in income and net worth; in fact, if we look over a person's life, racial gaps exist every step of the way. From the beginning of life, Black children are about twice as likely as either white or Hispanic children to not reach their first birthday. These gaps in infant mortality have existed over many years, and even if you control for the educational level of the mother, the gaps remain.
Black and white children tend to grow up in different neighborhoods, and this racial stratification leads to other risks that can affect longer-term economic outcomes. One example is children's lead toxicity – the amount of lead in one's bloodstream – which at elevated levels causes brain damage and has significant adverse effects on a child's ability to learn. A study of Chicago neighborhoods found that even though lead poisoning in children has fallen significantly over time as a result of public health policy, it is still the case that those neighborhoods with the highest levels of toxicity are predominantly Black neighborhoods.15
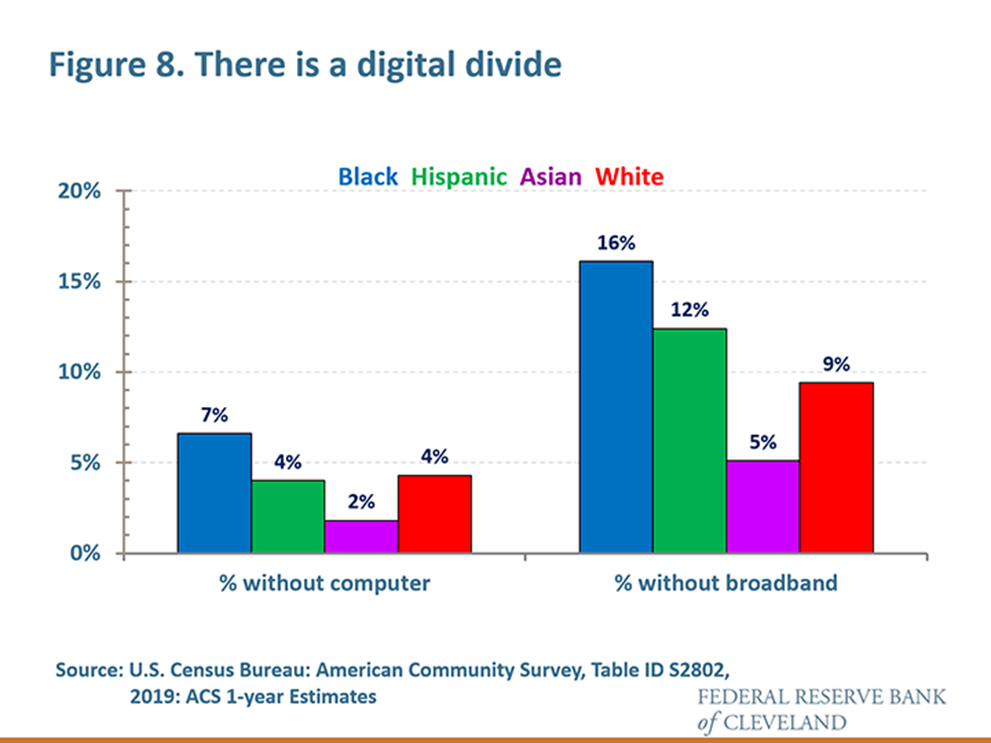
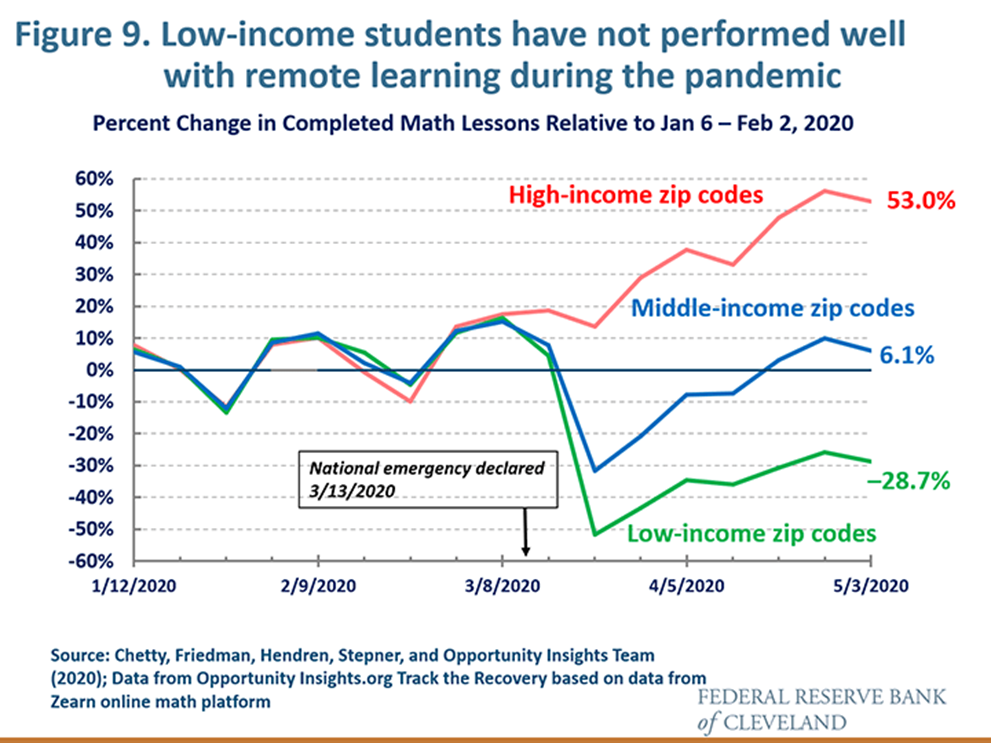
[FIGURE 8] While lead poses one significant disadvantage to learning, lack of internet connectivity poses another. Well before the coronavirus pandemic, access to the internet was an important avenue for education, as well as for healthcare and job access. Usage of broadband at home is comparatively higher for whites, those with higher incomes, and those in urban and suburban areas.16 Blacks and Hispanics are less likely to have a computer or broadband at home than whites, and when they do have a computer, they are less likely to have broadband service at home. This puts Black and Hispanic families at a disadvantage, especially now, given the pandemic, when remote in-home learning is the norm rather than the exception.
[FIGURE 9] In fact, during the spring, students in lower-income areas completed significantly fewer math courses online than those in higher-income areas.18 If these differences continue, there could be lasting effects on students' earning potential throughout their lives, leading to further inequality.
Gaps over the Life Cycle: College Ages
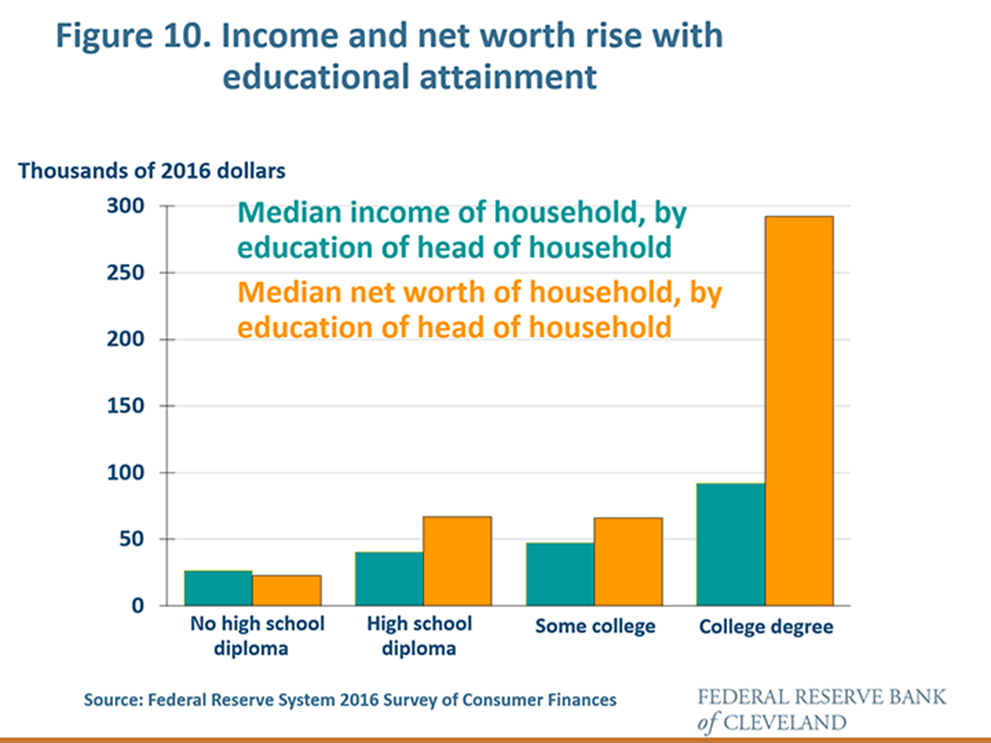
[FIGURE 10] Indeed, the accumulation of human capital via education is an important path to economic inclusion and opportunity, resulting in better economic outcomes for individuals, households, and the country at large. The median income for families whose head has a college degree is more than twice as high as that of a family whose head has only a high school diploma. Similarly, median net worth is considerably higher for those with a college degree.19
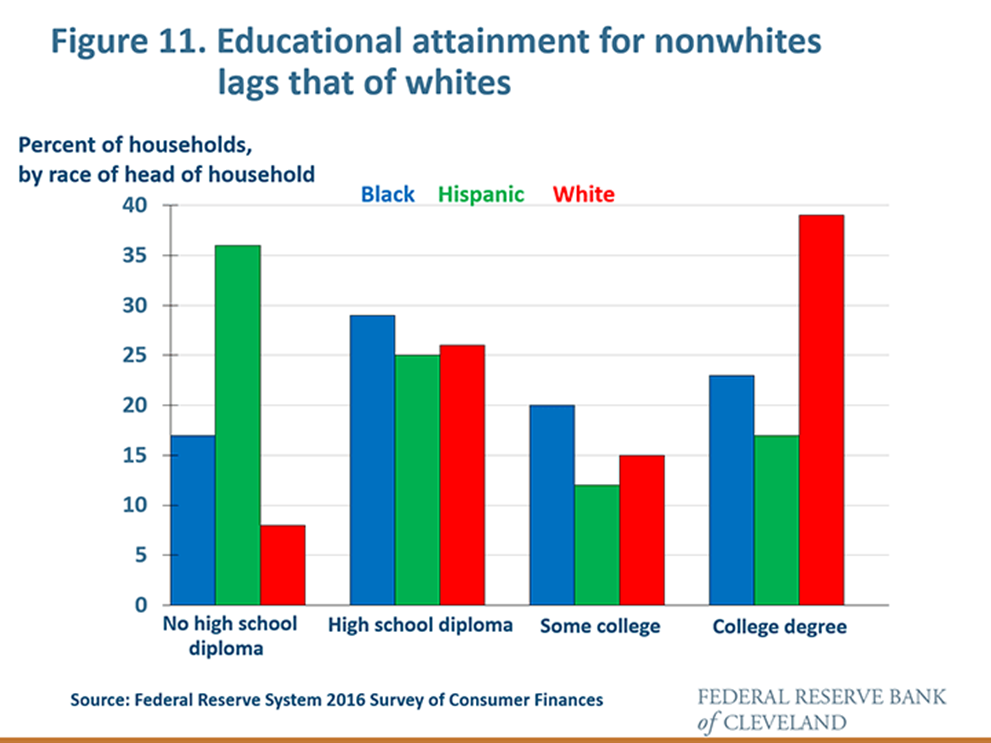
[FIGURE 11] While our workforce as a whole has become more educated over time, educational attainment differs by race, as does the likelihood of completing a degree. In the Fed's Survey of Consumer Finances, 39 percent of white heads of household held a college degree compared to 23 percent of Black heads of household and 17 percent of Hispanic heads of household.20
Cost can be an important barrier to entering college, particularly for those coming from lower-income families. The average cost of tuition and fees at four-year institutions is now over $16,000 a year, and adjusted for inflation, it has more than doubled over the past three decades.21 According to the Fed's survey on economic well-being, as of late 2019, over 40 percent of those who went to college had taken on debt for their education and about half of those people still owe money on this debt.22 New York Fed analysis shows that compared to borrowers in majority white areas, those in majority Black areas have higher student loan balances and those in majority Black and majority Hispanic areas have higher rates of default on those loans.23 These defaults can follow a person over time, making it harder to access credit in the future.
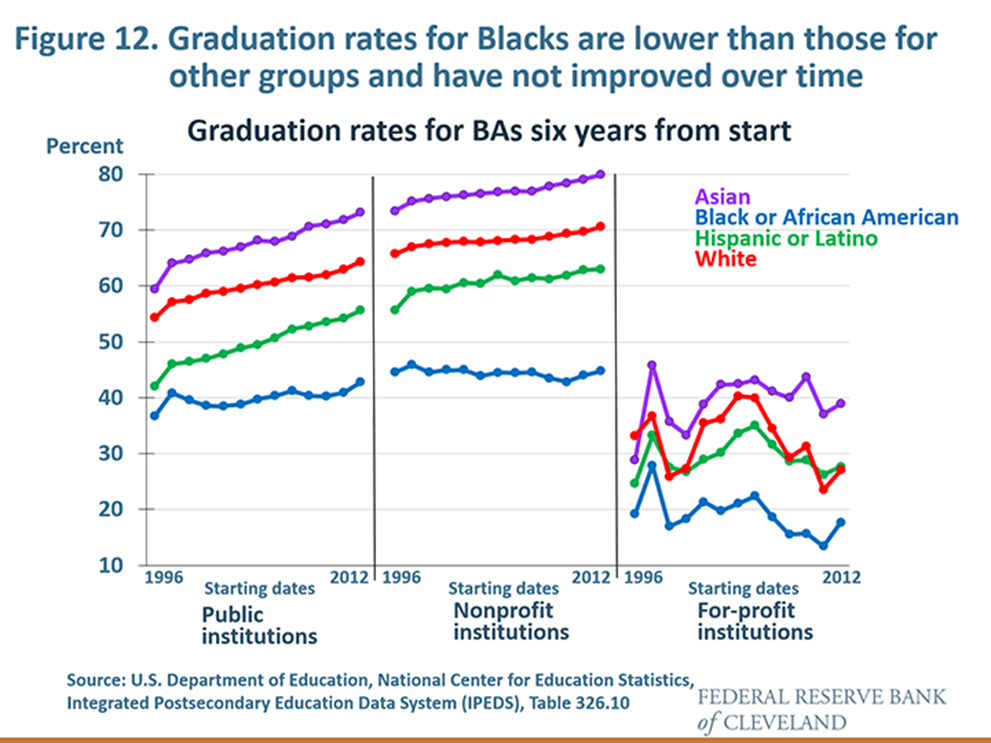
[FIGURE 12] For those students who do find the financial means to enter college, the likelihood of completing a degree differs by type of institution and by race. The completion rates have remained particularly low at for-profit institutions. At both public and nonprofit private institutions, the graduation rates for whites, Hispanics, and Asians have all risen over time, but those of Blacks remain well below those of these other groups and have shown no progress over time.
Satisfaction with college also varies by race. About 70 percent of white recipients of bachelor's degrees felt that their education was worth the cost, but only slightly more than half of Black recipients did.24
Gaps over the Life Cycle: Earning Years – Labor Markets and Credit Markets
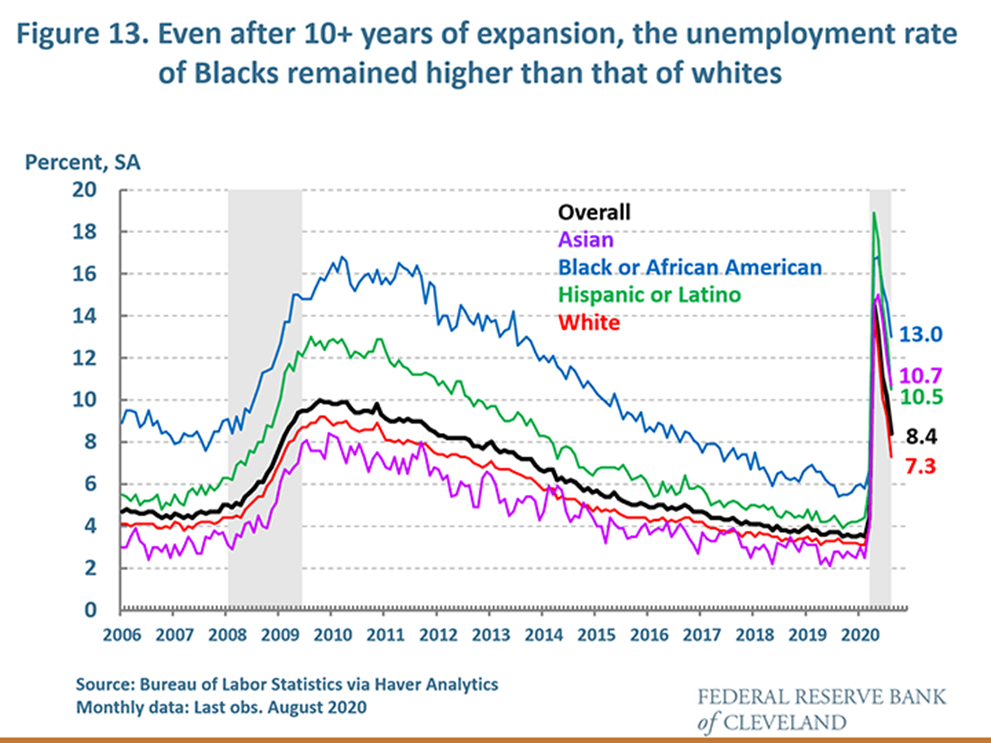
[FIGURE 13] The differences in educational attainment across races follow people as they enter the workforce. There are significant racial disparities in labor market outcomes. Unemployment rates among Blacks and Hispanics have been chronically above those of whites and Asians, and Blacks and Hispanics are more likely to lose their jobs during recessions. Although some progress had been made over the long economic expansion that ended in February, racial disparities remained. Research from Fed economists indicates that while lower educational attainment explains much of the difference in the unemployment experience of Hispanics, this is not true for the Black-white gap. In fact, observable characteristics, like education, age, or marital status, cannot fully account for the higher and more cyclical unemployment of Blacks relative to whites.25
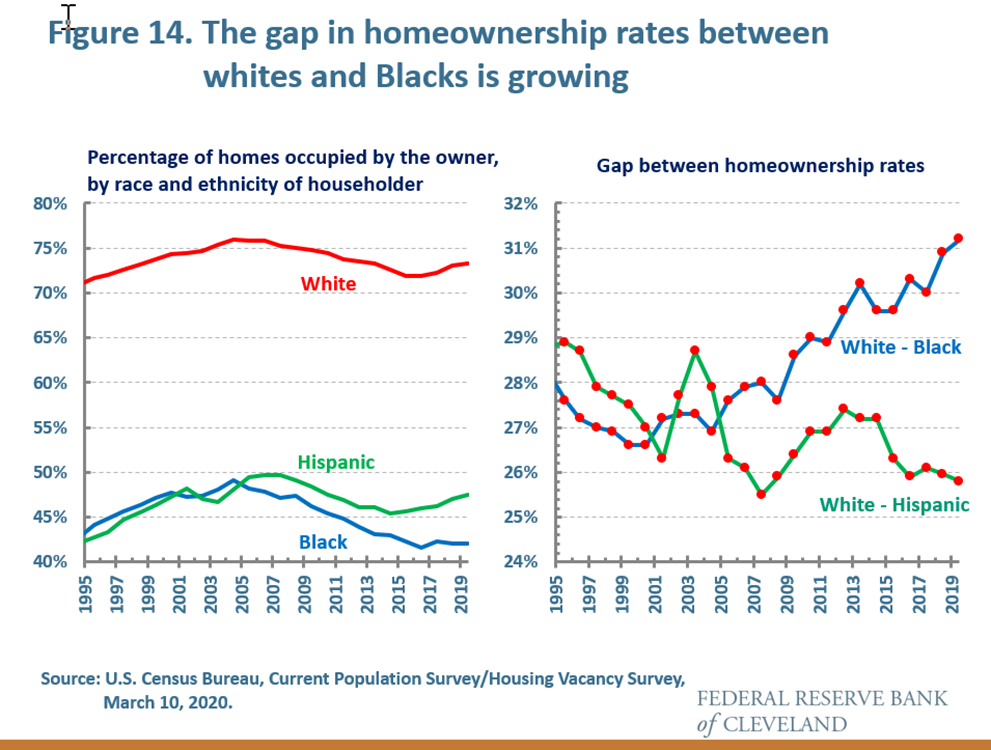
[FIGURE 14] These long-standing labor market disparities spill over in other ways that limit Black households' ability to fully participate in the economy. Worse and more volatile labor market outcomes make it harder for nonwhite families to build assets and achieve sound financial health.
For those families that are able to get a mortgage, job insecurity makes the household less financially resilient and raises the risk that the household might fall behind on its mortgage or even default, putting the family's longer-term financial health at risk. Housing continues to be an important way for families to build wealth, but even controlling for income and other factors related to creditworthiness, there is a rising gap between the homeownership rate of whites and Blacks. This indicates that systemic racial differences in access to credit have persisted well after enactment of fair housing and lending legislation in the 1970s meant to address the scourge of redlining and discrimination in credit markets.26,27
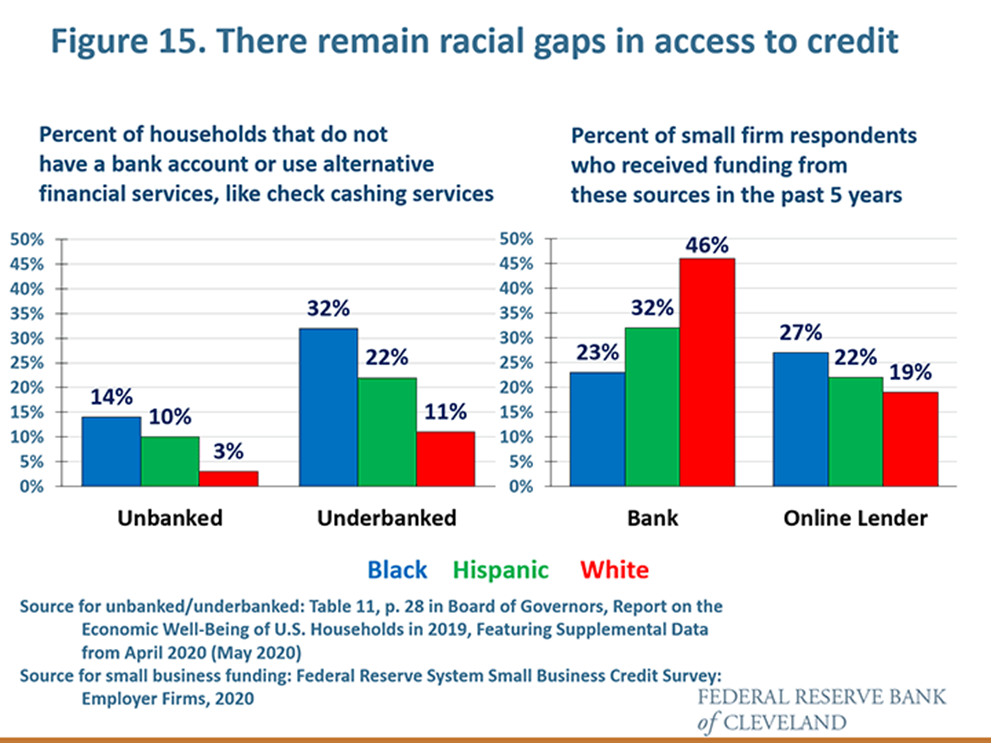
[FIGURE 15] In terms of access to financial services, Blacks and Hispanics are less likely to have a bank account and more likely to rely on alternative financial services such as money orders and check cashing services than whites. Being unbanked or underbanked makes it harder for these families to build a credit history.28
The use of bank financing by small businesses also varies significantly with the race of the owner. According to the Fed's Small Business Credit Survey, compared to small firms with white ownership, those with Black ownership were half as likely to have obtained financing from a bank in the past five years, relying more on online lenders, which, according to survey respondents, provide less satisfactory service.29
Much Needs to Be Done to Address Economic Disparities and Promote Economic Inclusion
Eliminating racial and economic disparities, which have lasted over generations, is no easy task. It will take concerted action at the individual, professional, and institutional level to change structures and systems that perpetuate these gaps. But this work needs to be done so that all people have the opportunity to fully participate in the U.S. economy. The research I discussed today points to four priorities.
Investing in neighborhoods and communities must be a priority. Place matters and at smaller geographical divisions than might be expected. Localized, neighborhood-based community development work and investments aimed at reducing poverty rates, improving school quality and housing choices, and revitalizing neighborhoods can offer families more stability. Focusing on improving neighborhoods can have results. In 2016, the Cleveland Fed convened all those interested in contributing to the efforts of the Lead Safe Cleveland Coalition and the city of Cleveland in preventing lead poisoning in the city.30 And last July, Cleveland City Council passed an important piece of legislation requiring, among other provisions, that landlords pay for private inspections and certifications that their occupied units are lead-safe, with penalties for noncompliance.31
Closing the digital divide must be a priority. Among communities with a population of 100,000 or more, the city of Cleveland has among the lowest home broadband access in the nation.32 Business leaders through the Greater Cleveland Partnership are working with the city's governmental leaders and other organizations to ensure that all residents in the Greater Cleveland area have access to in-home high-quality broadband and devices to access it. Similar work is being done in Pittsburgh by the Allegheny Conference on Community Development.
Increasing access to high-quality education at all levels must be a priority. Education is a significant avenue to economic opportunity. Recognizing that a higher-skilled workforce benefits communities, Ohio has a project underway to try to increase educational attainment.33 Issues with cost and preparation need to be addressed. Respondents to recent Fed surveys said that the cost of college and family obligations are among the reasons they did not complete their degree.34 Low grades were also cited as a reason. Adequate preparation for college has an impact on completion rates and likely on satisfaction. Research is increasingly pointing to the fact that children who fall behind have difficulty catching up.35 Tutoring and mentoring throughout a student's elementary, high school, and college years can support a student through to earning a degree.
In addition, financial literacy should be included in elementary and high school curricula. Such courses will give students the skills to evaluate the various options for financing their education, determine which types of educational institutions offer a good return on their investment, and lead to better savings, investment, and credit decisions throughout their lives. The Cleveland Fed actively supports economic and financial literacy programs, and this year we will be hosting the Council of Economic Education's National Personal Finance Challenge, a competition for high school students that encourages development of financial management skills.
Eliminating systemic inequities in access to credit and financial services must be a priority. The racial disparities that still exist in banking and credit markets mean institutions need to reassess their business practices and change those that are found to be sources of such disparities. Similarly, policymakers need to strengthen policies meant to address such inequities. The Federal Reserve is currently working to strengthen the regulations that implement the Community Reinvestment Act (CRA). The act, passed in 1977, was intended to help address concerns about disinvestment in low- and moderate-income neighborhoods and the impact of illegal practices such as redlining. The CRA reaffirmed that insured depository institutions must serve the communities in which they are chartered to do business. Evidence shows that the CRA has provided tangible benefits to low- and moderate-income neighborhoods. With the many changes in banking since the 1970s, it is time to modernize the regulation so that it can help to address systemic inequities in access to financial services and credit for low- and moderate-income and minority communities and individuals.36
Of course, much more needs to be done. But if we have focus, perseverance, and a shared commitment to eliminating systemic racism and increasing the breadth of economic opportunity, then together we can ensure that instead of being a pipe dream for some, the American Dream is available to all.
https://youtu.be/k18B3yqjynI
Footnotes
- In these remarks, I will use the term “race” to refer to race and ethnicity, and “Hispanic” to refer to Hispanic and Latinx. Return to 1
- Results from the recently released Board of Governors survey on the economic well-being of households (Table 1, p. 3 of Board of Governors, September 2020) show that between March and July, 28 percent of workers in families making less than $40,000 a year were laid off (including being told not to work any hours), considerably higher than the 13 percent of workers from families with incomes over $100,000 a year. Furthermore, a quarter of workers in low-income families who experienced a layoff reported that they had returned to work for the same employer, while nearly 40 percent of high-income workers did so. Twenty-three percent of workers with a high school diploma or less were laid off between March and July, compared to 13 percent of workers with a college degree or more, and 22 percent of Black workers and 23 percent of Hispanic workers were laid off compared to 18 percent of white workers. Return to 2
- See Fairlie (2020). Researchers at the New York Fed point to a number of contributing factors, including these firms’ weaker financial cushions, weaker bank relationships, and funding gaps that existed prior to the pandemic, plus less access to federal relief funds. See Mills and Battisto (2020). Return to 3
- Chetty and Williams (2019). Return to 4
- Chetty, et al. (2017). Return to 5
- Corak (2013). Return to 6
- Maps showing income mobility at the zip code level for different levels of income, race, and gender are available at https://www.OpportunityAtlas.org, a collaboration between the U.S. Census Bureau and Opportunity Insights. The map shown here is based on the average income at age 35 of a child whose parents earned in the 25th percentile of the income distribution, in other words, in low-income families. Return to 7
- See Chetty and Hendren (2018), Chetty, et al. (2018, revised 2020), and Chetty and Williams (2019). Return to 8
- The effect is found for children who move by the age of 13; it does not apply to adults. Each year of exposure to a better neighborhood has a greater benefit for the child. See Chetty, et al. (2018, revised 2020) and Chetty and Hendren (2018). Return to 9
- One study of Australia found that where a child grows up, especially in his or her teenage years, has a causal effect on adult outcomes. See Deutscher (2020). Return to 10
- Controlling for parental income, in adulthood, Black males end up having lower earnings than white males in 99 percent of Census tracts in the U.S. For those who grew up in neighborhoods of low poverty and higher rent, both Black and white males have better outcomes, but the gap between them is greater than in high poverty areas. The gap is smaller when fathers are present and when measures of racial bias are lower. See Chetty, et al. (2020). Return to 11
- See the Federal Reserve System 2016 Survey of Consumer Finances (SCF) (2017). In 2016 dollars, the median income in 2016 for white, Black, and Hispanic families were $61,000, $35,000, and $38,000, respectively. Return to 12
- For further discussion of racial net worth disparities over time, see Aliprantis, Carroll, and Young (2019). Return to 13
- According to the SCF data, in 2016 dollars, the median net worth in 2016 of white, Black, and Hispanic families were $171,000, $17,600, and $20,700, respectively. Return to 14
- See Sampson and Winter (2016). Return to 15
- According to Pew Research Center survey data, in 2019, usage of broadband at home was 79 percent of whites, 66 percent of Blacks, and 61 percent of Hispanics; 92 percent for those earning $75,000 or more per year and 56 percent for those earning less than $30,000 per year; 75 percent for those in urban areas, 79 percent for those in suburban areas, and 63 percent for those in rural communities. See Pew Research Center (2019). Return to 16
- Estimates for 2019 from the U.S. Census Bureau indicate that about 2 percent of Asian households, 4 percent of white households, 4 percent of Hispanic households, and 7 percent of Black households do not have a computer at home. About 95 percent of Asian households, 90 percent of white households, 88 percent of Hispanic households, and 84 percent of Black households have a computer and broadband at home. See U.S. Census Bureau, American Community Survey, Subject Table S2802, 2019 1-year estimates. (Note: These estimates on broadband are higher than those from Pew, cited in footnote 16, which pertain to usage.) Return to 17
- See the Zearn math platform data at Opportunity Insights: Economic Tracker, and Chetty, et al. (2020). Return to 18
- According to the Federal Reserve System 2016 Survey of Consumer Finances, in 2016, the median income of families whose head has a college degree was $90,000 compared with $40,000 for families whose head had only a high school diploma. See Federal Reserve System (2017). Return to 19
- See Dettling, et al. (2017). Return to 20
- See Digest of Education Statistics Return to 21
- See pp. 43-46, Board of Governors of the Federal Reserve System (May 2020). Return to 22
- See Chakrabarti, Nober, and van der Klaauw (2020). Return to 23
- See Figure 28, p. 39, in Board of Governors (May 2020). Return to 24
- See Cajner, et al. (2017). Return to 25
- See also Choi (2020). Return to 26
- For documentation and discussion of the racial gaps in homeownership rates, see Haughwout, et al. (2020). Return to 27
- See Table 11, p. 28, in Board of Governors of the Federal Reserve System (May 2020). Unbanked is defined as not having a checking, savings, or money market account. Underbanked is defined as having a checking, savings, or money market account but having used one of these alternative financial services: money order, check cashing service, pawn shop loan, auto title loan, payday loan, paycheck advance, or tax refund advance. Return to 28
- According to the Fed’s most recent Small Business Credit Survey of firms with 1-499 employees, 46 percent of firms with white ownership, 32 percent of firms with Hispanic ownership, and 23 percent of firms with Black ownership had obtained financing from a bank in the past five years; 19 percent of firms with white ownership, 22 percent of firms with Hispanic ownership, and 27 percent of firms with Black ownership had obtained financing from an online lender in the past five years. See Federal Reserve System (2020), p. 9. Return to 29
- See Federal Reserve Bank of Cleveland (2016). Return to 30
- See Dissell and Zeltner (2019). Return to 31
- The data are available in Table GCT2801, U.S. Census American Community Survey (2019). In the city of Cleveland, 69.3 percent of households have a broadband internet subscription. Only Lakewood Township, Ocean County, N.J. has lower internet connectivity, at 58.9 percent. The numbers for the U.S. and for the city of Pittsburgh are 86.4 percent and 86.5 percent, respectively. Return to 32
- Ohio Excels, partnering with the Complete to Compete Ohio Coalition, has developed a statewide action plan to increase postsecondary educational attainment in the state. See Ohio Excels (2020) and Wright-McGowan (2020). Return to 33
- According to the Fed survey of economic well-being, of those respondents who could not complete their associate’s or bachelor’s degree, among other reasons, 56 percent said it was because it was too expensive, 52 percent said it was because they needed to earn money to take care of their family, and 22 percent said it was because of low grades. Respondents could choose more than one reason. See Board of Governors of the Federal Reserve System (May 2020), Table 23, p. 41. Return to 34
- See Mester (2015). Return to 35
- The Board of Governors issued its Advance Notice of Proposed Rulemaking (ANPR) to strengthen, clarify, and tailor the CRA regulation, and other materials summarizing the ANPR on September 21, 2020. See Board of Governors of the Federal Reserve System (September 21, 2020) and Brainard (2020). Return to 36
References
- Aliprantis, Dionissi, Daniel R. Carroll, and Eric R. Young, “The Dynamics of the Racial Wealth Gap,” Federal Reserve Bank of Cleveland Working Paper 19-18, October 2019. (https://www.doi.org/10.26509/frbc-wp-201918).
- Board of Governors of the Federal Reserve System, “Report on the Economic Well-Being of U.S. Households in 2019, Featuring Supplemental Data from April 2020,” May 2020. (https://www.federalreserve.gov/publications/files/2019-report-economic-well-being-us-households-202005.pdf)
- Board of Governors of the Federal Reserve System, “Update on the Economic Well-Being of U.S. Households: July 2020 Results,” September 2020. (https://www.federalreserve.gov/publications/files/2019-report-economic-well-being-us-households-update-202009.pdf)
- Board of Governors of the Federal Reserve System, “Federal Reserve Board Issues Advance Notice of Proposed Rulemaking on an Approach to Modernize Regulations That Implement the Community Reinvestment Act,” press release, September 21, 2020. (https://www.federalreserve.gov/newsevents/pressreleases/bcreg20200921a.htm)
- Brainard, Lael, “Strengthening the CRA to Meet the Challenges of Our Time,” remarks at the Urban Institute, Washington, D.C., September 21, 2020. (https://www.federalreserve.gov/newsevents/speech/brainard20200921a.htm)
- Cajner, Tomaz, Tyler Radler, David Ratner, and Ivan Vidangos, “Racial Gaps in Labor Market Outcomes in the Last Four Decades and over the Business Cycle,” Finance and Economics Discussion Series 2017-071, Board of Governors of the Federal Reserve System, June 12, 2017. (https://doi.org/10.17016/FEDS.2017.071)
- Chakrabarti, Rajashri, William Nober, and Wilbert van der Klaauw, “Measuring Racial Disparities in Higher Education and Student Debt Outcomes,” Federal Reserve Bank of New York Liberty Street Economics, July 8, 2020.(https://libertystreeteconomics.newyorkfed.org/2020/07/measuring-racial-disparities-in-higher-education-and-student-debt-outcomes.html)
- Chetty, Raj, John N. Friedman, Nathaniel Hendren, Maggie R. Jones, and Sonya R. Porter, “The Opportunity Atlas: Mapping the Childhood Roots of Social Mobility,” National Bureau of Economic Research Working Paper 25147, October 2018, revised February 2020. (http://www.nber.org/papers/w25147)
- Chetty, Raj, John N. Friedman, Nathaniel Hendren, Michael Stepner, and the Opportunity Insights Team, “The Economic Impacts of COVID-19: Evidence from a New Public Database Built from Private Sector Data,” manuscript, September 2020. (https://opportunityinsights.org/wp-content/uploads/2020/05/tracker_paper.pdf)
- Chetty, Raj, David Grusky, Maximilian Hell, Nathaniel Hendren, Robert Manduca, and Jimmy Narang, “The Fading American Dream: Trends in Absolute Income Mobility Since 1940,” Science, 356 (April 28 2017), pp. 398-406. (https://science.sciencemag.org/content/356/6336/398)
- Chetty, Raj, and Nathaniel Hendren, “The Impacts of Neighborhoods on Intergenerational Mobility I: Childhood Exposure Effects,” The Quarterly Journal of Economics 133 (August 2018), pp. 1107-1162 (https://doi.org/10.1093/qje/qjy007)
- Chetty, Raj, Nathaniel Hendren, Maggie R. Jones, and Sonya R. Porter, “Race and Economic Opportunity in the United States: An Intergenerational Perspective,” The Quarterly Journal of Economics 135 (May 2020), pp. 711-783. (https://doi.org/10.1093/qje/qjz042)
- Chetty, Raj, and David Williams, “Improving Equality of Opportunity: New Insights from Big Data,” Federal Reserve Bank of Cleveland Policy Summit, Cincinnati, OH, June 19-21, 2019. (https://www.clevelandfed.org/events/Policy-Summit/2019/Policy-Summit-2019)
- Choi, Jung Hyun, “Breaking Down the Black-White Homeownership Gap,” Urban Wire: Housing and Housing Finance (blog), Urban Institute, February 21, 2020. (https://www.urban.org/urban-wire/breaking-down-black-white-homeownership-gap)
- Corak, Miles, “Income Inequality, Equality of Opportunity, and Intergenerational Mobility,” Journal of Economic Perspectives, 27 (Summer 2013), pp. 79-102. (https://doi.org/10.1257/jep.27.3.79)
- Dettling, Lisa J., Joanne W. Hsu, Lindsay Jacobs, Kevin B. Moore, and Jeffrey P. Thompson, “Recent Trends in Wealth-Holding by Race and Ethnicity: Evidence from the Survey of Consumer Finances,” Finance and Economics Discussion Series Notes, September 27, 2017. (https://www.federalreserve.gov/econres/notes/feds-notes/recent-trends-in-wealth-holding-by-race-and-ethnicity-evidence-from-the-survey-of-consumer-finances-20170927.htm)
- Deutscher, Nathan, “Place, Peers, and the Teenage Years: Long-Run Neighborhood Effects in Australia,” American Economic Journal: Applied Economics 12 (April 2020), pp. 220-249. (https://doi.org/10.1257/app.20180329)
- Digest of Education Statistics, Table 330.10, “Average Undergraduate Tuition and Fees and Room and Board Rates Charged for Full-Time Students in Degree-Granting Postsecondary Institutions, by Level and Control of Institution: Selected Years, 1963-64 through 2018-19.” (https://nces.ed.gov/programs/digest/d19/tables/dt19_330.10.asp)
- Dissell, Rachel, and Brie Zeltner, “Cleveland City Council Passes Historic Lead Poisoning Prevention Law,” The Plain Dealer, July 24, 2019. (https://www.cleveland.com/metro/2019/07/cleveland-city-council-passes-historic-lead-poisoning-prevention-law.html)
- Fairlie, Robert W., “The Impact of Covid-19 on Small Business Owners: Evidence of Early-Stage Losses from the April 2020 Current Population Survey,” National Bureau of Economic Research Working Paper 27309, June 2020. (https://www.nber.org/papers/w27309)
- Federal Reserve Bank of Cleveland, “Addressing the Impacts of Lead: Moving Toward Prevention,” November 18, 2016. (https://www.clevelandfed.org/en/newsroom-and-events/events/2016/addressing-the-impacts-of-lead.aspx)
- Federal Reserve System, 2016 Survey of Consumer Finances (2017). (https://www.federalreserve.gov/econres/scfindex.htm)
- Federal Reserve System, Federal Reserve Small Business Credit Survey: 2020 Report on Employer Firms, 2020. (https://www.fedsmallbusiness.org/medialibrary/FedSmallBusiness/files/2020/2020-sbcs-employer-firms-report)
- Haughwout, Andrew, Donghoon Lee, Joelle Scally, and Wilbert van der Klaauw, “Inequality in U.S. Homeownership Rates by Race and Ethnicity,” Federal Reserve Bank of New York Liberty Street Economics, July 8, 2020. (https://libertystreeteconomics.newyorkfed.org/2020/07/inequality-in-us-homeownership-rates-by-race-and-ethnicity.html)
- Mester, Loretta J., “Community Development and Human Capital,” remarks at the 2015 Policy Summit on Housing, Human Capital, and Inequality, Federal Reserve Banks of Cleveland, Philadelphia, and Richmond, Pittsburgh, PA, June 19, 2015. (https://www.clevelandfed.org/Collections/Speeches/2015/sp-20150619-community-development-and-human-capital)
- Mills, Claire Kramer, and Jessica Battisto, “Double Jeopardy: COVID-19’s Concentrated Health and Wealth Effects in Black Communities,” Brief, Federal Reserve Bank of New York, August 2020. (https://www.newyorkfed.org/medialibrary/media/smallbusiness/DoubleJeopardy_COVID19andBlackOwnedBusinesses)
- Ohio Excels, “Bridging Ohio’s Workforce Gap,” August 2020. (https://completetocompeteohio.org/wp-content/uploads/Bridging-Ohios-Workforce-Gap-Attainment-Plan-August-2020.pdf)
- The Opportunity Atlas. (https://www.OpportunityAtlas.org)
- Opportunity Insights: Economic Tracker. (https://tracktherecovery.org/)
- Pew Research Center, “Internet/Broadband Fact Sheet: Who Has Home Broadband?” June 12, 2019. (https://www.pewresearch.org/internet/fact-sheet/internet-broadband/#who-has-home-broadband)
- Sampson, Robert J., and Alix S. Winter, “The Racial Ecology of Lead Poisoning: Toxic Inequality in Chicago Neighborhoods, 1995-2013,” Du Bois Review: Social Science Research on Race 13 (Fall 2016), pp. 261-283. (https://doi.org/10.1017/S1742058X16000151)
- U.S. Census Bureau, American Community Survey, Subject Table S2802, “Types of Internet Subscriptions by Selected Characteristics,” 2019 1-Year Estimates. (https://data.census.gov/cedsci/table?q=S2802)
- U.S. Census Bureau, American Community Survey, Geographic Comparison Table GCT2801, “<Percent of Households with a Broadband Internet Subscription,” 2019 1-Year Estimates. (https://www.census.gov/acs/www/data/data-tables-and-tools/geographic-comparison-tables/)
- Wright-McGowan, Margie, “The Stakes Are High and There're No Second Chances When It Comes to Preparing Students for Success,” remarks at Aim ‘Hire’: Workforce and Education Symposium and Fall Series, Ohio Excels and the Governor's Office of Workforce Transformation, Columbus, OH, September 22, 2020. (https://www.clevelandfed.org/en/newsroom-and-events/speeches/sp-20200922-wright-mcgowan.aspx)
Suggested Citation
Mester, Loretta J. 2020. “Toward a More Inclusive Economy.” Speech, Economic Equality Webinar - African American Chamber of Commerce of Western Pennsylvania - Pittsburgh, PA (via videoconference).
- Share