

Home Mortgage Lending by Race and Income in a Time of Low Interest Rates: Examples from Select Counties in Kentucky, Ohio, and Pennsylvania from 2018 through 2021
Introduction
Signed into law in 1975 by President Ford, the Home Mortgage Disclosure Act (HMDA) requires most financial institutions to disclose information on their mortgage lending. Annually, this information creates a publicly accessible data set that includes millions of records and covers about 90 percent of mortgage lending in the United States (Gerardi, Willen, and Zhang, 2020). More information on HMDA can be found in this summary: What is HMDA and why is it important?
Several years ago, the Cleveland Fed examined data for seven large urban counties in the Fourth District.1 At that time, we looked at how these counties performed post-Great Recession. In this report, we revisit those seven counties and examine how they performed during the COVID-19 pandemic and in an environment of record-low interest rates.
This report is an analysis of HMDA data from 2018 through 2021 in seven counties: Allegheny, Pennsylvania (Pittsburgh); Cuyahoga, Ohio (Cleveland); Fayette, Kentucky (Lexington); Franklin, Ohio (Columbus); Hamilton, Ohio (Cincinnati); Lucas, Ohio (Toledo); and Montgomery, Ohio (Dayton). It focuses on several aspects of mortgage lending categorized by borrower race and income.
Key findings
- From 2018 through 2021, growth in home purchase originations was much stronger for Black borrowers (up 38 percent) than non-Black borrowers (up 9 percent) in the seven large urban counties examined in this report.2 This strong growth was also evident among low- and moderate-income (LMI) Black borrowers.3
- In 2021, the Black homeownership rate was 35 percent in the seven counties, an increase of nearly 2 percentage points from 2018. Non-Black homeownership rates remained unchanged at 66 percent. The gap between the two remained wide, at 30.7 percentage points.
- From 2018 through 2020, refinances increased rapidly, particularly for non-Black homeowners, who saw increases of 248 percent compared to 95 percent for Black homeowners. In 2020 and 2021, that trend flipped, and Black homeowners saw refinances increase at a greater rate than non-Black homeowners (69 percent compared to 7 percent, respectively). This was particularly true for LMI, Black homeowners, whose refinances increased 91 percent.
What the data tell us
From 2018 through 2021, two events happened that greatly impacted the mortgage lending environment: record-low interest rates and the COVID-19 pandemic. By the end of 2020, the average interest rate for 30-year, fixed-rate mortgages reached 2.65 percent. That’s the lowest rate recorded, with data going back to 1971 when the rate was first tracked (Freddie Mac, 2022). Although they rose a bit in 2021, interest rates remained among the lowest on record. The result was a surge in refinances and a general increase in home purchases. Along with low interest rates, millennials, currently the largest adult population in the United States, were entering their peak homebuying years as the COVID-19 pandemic caused people to rethink their housing situations (Friedman, 2020). Remote work offered people greater flexibility in choosing where they lived, and it made the home office a more valuable space. Stimulus checks, student loan forbearance, and less spending on travel and entertainment during the COVID-19 lockdowns allowed many households to save up for down payments (Friedman, 2021b). However, decades of underbuilding combined with homeowners’ moving less frequently and living in the same homes longer contributed to low inventory (Khater, Kiefer, and Yanamandra, 2021; Friedman, 2021a). Both the decline in interest rates and the effects of the pandemic greatly impacted the trends highlighted in this report.
Home mortgages
Overall, home purchase originations for the seven counties increased 15 percent from 2018 through 2021 (66,993 to 77,117), while the nation as a whole saw an increase of 19 percent. In the seven counties, these increases were greater for Black borrowers (38 percent) than for non-Black borrowers (9 percent) (Table 1). A similar trend was seen among LMI, Black borrowers.
| All originations | Black | Non-Black | |
| Seven counties | +15 | +38 | +9 |
| United States | +19 | +40 | +17 |
Source: Home Mortgage Disclosure Act data
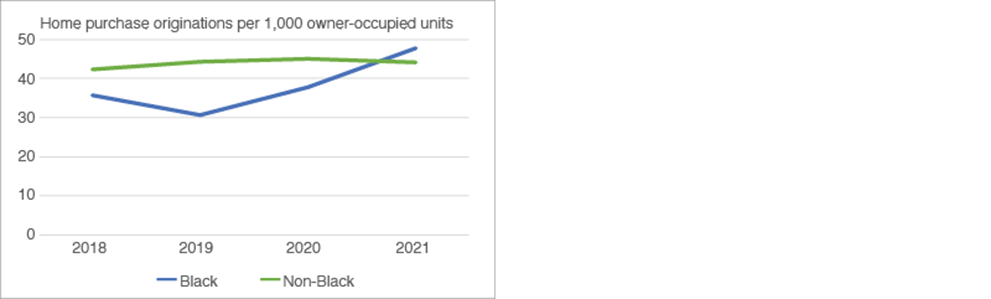
To compare home purchase originations across time and by race, it is helpful to examine home purchase origination rates, which are calculated as originations per 1,000 owner-occupied units by race. Figure 1 illustrates the strong growth in Black home purchases, which exceeds the rate of non-Black home purchases in 2021. This strong growth led the share of total homes purchased by Black borrowers to increase from 10.7 percent in 2018 to 13.1 in 2021, a trend seen nationally as well (Liu, Jo, and Chen, 2022). In turn, the Black homeownership rate increased 2 percentage points from 2018 through 2021, to 35 percent. Though the gap in homeownership rates between Black and non-Black households remained wide at 30.7 percentage points, it is worth exploring what fueled this growth in Black homebuyers. One factor is age. In 2021, the median age of Black Americans was about 35 years—the prime age for buying a home (Choi and Zinn, 2022).
Source: Author's calculations of Home Mortgage Disclosure Act data and US Census Bureau data
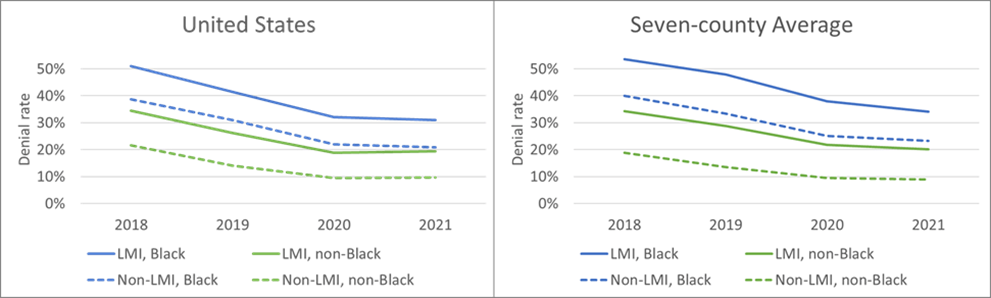
Home mortgage denials
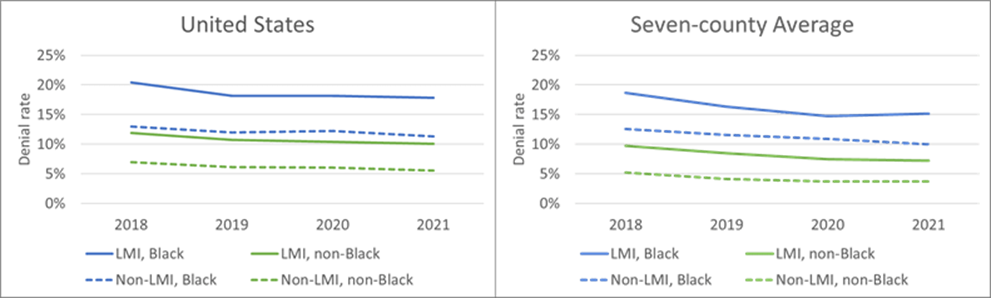
Denial rates declined in nearly every race and income category across the seven counties and in the nation from 2018 through 2021 (Figure 2). However, denial rates for Black applicants (blue lines) are consistently higher by around 7 percentage points than for non-Black applicants (green lines). This racial gap in denial rates is well-documented, but several recent papers have attempted to explain this issue using the confidential HMDA data set, which includes applicants’ credit scores (Bhutta, Hizmo, and Ringo, 2021; Ky and Lim, 2022; Popick, 2022). When controlling for credit score, as well as other variables such as debt-to-income (DTI) percentage and loan-to-value (LTV) ratio, the researchers found that the denial rate gap shrunk to 1.9–2.9 percentage points. This remaining gap could be due to discrimination, but the researchers also acknowledge that unobservable risk factors missing from the data could also be driving lenders’ decisions. Such factors include applicants’ liquid reserves, residency and employment stability requirements, bankruptcies, and previous foreclosures.
Source: Home Mortgage Disclosure Act data
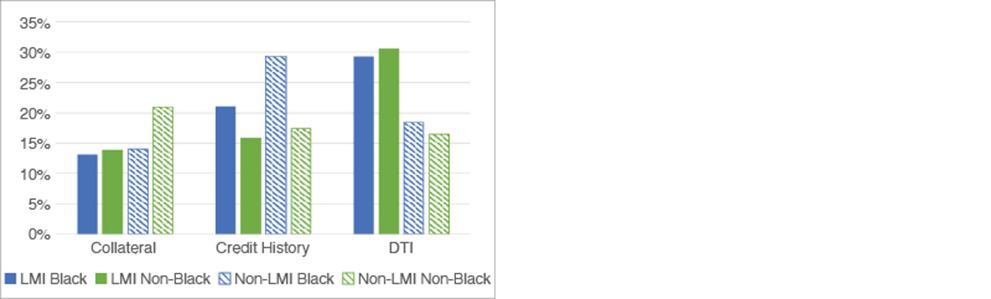
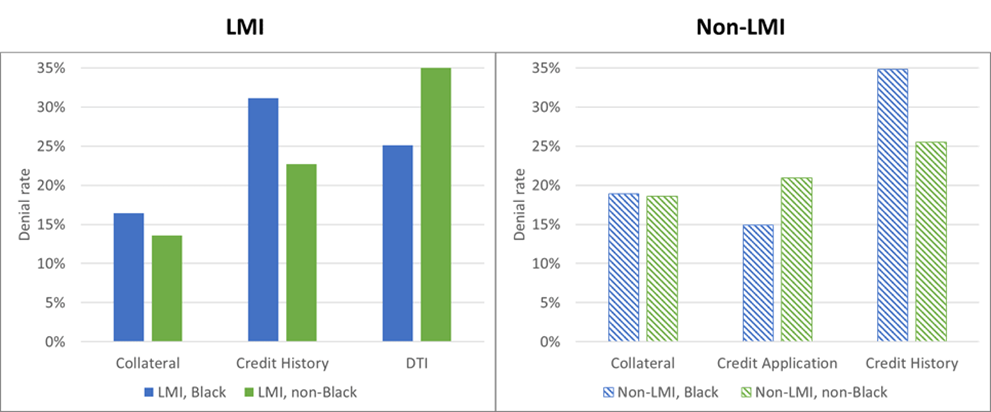
Public HMDA data include some reasons for denials, and financial institutions can select up to four from a list of nine reasons for each application. For this report, denial reasons were aggregated by borrower race and income for the seven counties during 2018–2021, then ranked. Across race and income groups, the three most common reasons households were denied a mortgage loan were collateral, credit history, and DTI. Collateral refers to the home’s value being less than the proposed loan amount. DTI is the applicant’s monthly debt payments divided by their gross monthly income. Lenders generally look for a DTI between 28 and 36 percent. For LMI applicants, DTI was the top reason for denial. These three reasons were similar when compared across race and income. However, credit history, a record of how debts were managed, was a more prevalent reason for Black applicants and collateral was a more prevalent reason for non-LMI, non-Black applicants (Figure 3).
Source: Home Mortgage Disclosure Act data
Refinances
Record-low interest rates spurred massive increases in refinance originations as homeowners looked to lower monthly payments or tap into their homes’ equity. Overall, refinance originations for the seven counties increased 269 percent from 2018 through 2021 (26,532 to 98,033), while the nation saw an increase of 295 percent (Table 2). Non-Black homeowners saw a larger increase in refinances both within the seven counties and in the nation as a whole.
| All originations | Black | Non-Black | |
| Seven counties | +269 | +231 | +273 |
| United States | +295 | +233 | +300 |
Source: Home Mortgage Disclosure Act data
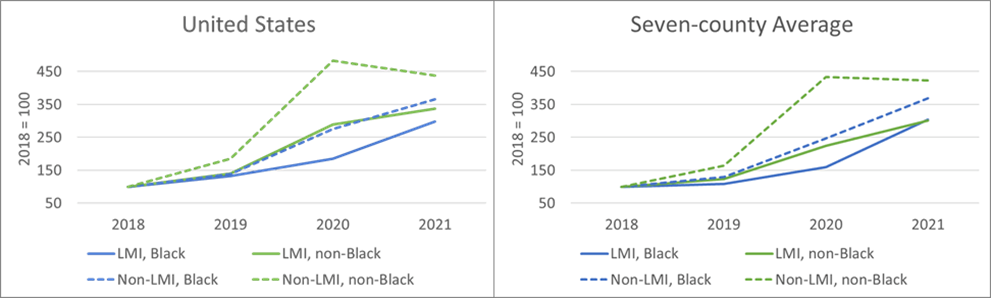
Figure 4 indexes the refinance originations for the seven-county average and the nation as a whole. For non-LMI, non-Black homeowners (dashed green line), the trend was a sharp increase in 2020 followed by a slight decrease in 2021. For Black homeowners (both LMI and non-LMI, blue lines) and LMI non-Black homeowners (solid green line), the trend was a steady increase from 2018 through 2021. Interestingly, in the seven counties from 2020 through 2021, Black homeowners saw refinances increase at a greater rate than non-Black homeowners (69 percent compared to 7 percent). This was particularly true for LMI, Black homeowners, who saw increases of 91 percent compared to 34 percent for LMI, non-Black homeowners.
Source: Home Mortgage Disclosure Act data
Though refinances increased dramatically, not all homeowners took advantage. Given the low interest rate environment in 2020 and 2021, it is interesting to see the fluctuations in refinance rates and to consider what would cause homeowners to forgo a process that could lead to such financial savings. Several researchers have developed possible answers to that question. First, refinancing is a complex financial calculation that requires significant borrower time and effort (Keys, Pope, and Pope, 2016; Agarwal, Rosen, Yao; 2016). Some homeowners are suspicious of financial institutions’ motives and may also be confused about the differences between the lender and the servicer and do not understand that each has different incentives for encouraging refinancing (Johnson, Meier, and Toubia, 2019). Another reason is related to neighbor influence and proximity. Owner-occupied households are less likely to refinance if their immediate neighbor did not refinance (McCartney and Shah, 2022). Additionally, low-income borrowers were often not solicited. And though researchers did not find evidence that lenders prioritized high-income borrowers, they found that low-income borrowers were underrepresented in the 2020 application pool (Agarwal et al., 2021). One final reason is related to forbearance. During the COVID-19 pandemic, forbearance—a promise by lenders to take no action against borrowers who miss payments—was extensively granted under the 2020 CARES Act. Although it varies by home loan type, most mortgages require homeowners to make three consecutive payments after exiting forbearance before they can refinance. Borrowers who entered forbearance and remained behind on payments during the pandemic may not have been able to refinance and benefit from the record-low interest rates. Unfortunately, this means that borrowers who likely would have been most helped by refinancing may have been the least able to (Gerardi, Lambie-Hanson, and Willen, 2021).
Refinance denials
Similar to home mortgage denials, from 2018 through 2021, refinance denial rates declined for all race and income groups. And like home purchases, denial rates for Black applicants (blue lines) remained consistently higher than for their non-Black counterparts (green lines) (Figure 5). However, from 2018 through 2021, the gap between Black denial rates and non-Black denial rates narrowed in both the seven counties and the nation as a whole.
Source: Home Mortgage Disclosure Act data
Denial reasons were aggregated by applicant race and income for the seven counties during 2018–2021, then ranked (Figure 6). Collateral and credit history were the most common reasons for both LMI and non-LMI applicants, but Black applicants, regardless of income, were more likely to be denied for credit history than non-Black applicants.
Source: Home Mortgage Disclosure Act data
Conclusion
During the past few years, the housing market has experienced an exceptional combination of events. Mortgage interest rates reached historic lows, increasing demand for buying homes and refinancing mortgages. At the same time, a pandemic-induced economic shutdown and an increase in remote work caused households to rethink their living arrangements. Together, these events helped create a nationwide situation of high demand and low supply. It is a unique situation, lacking precedence. With that in mind, in this report, I examined mortgage lending in seven large Fourth District counties from 2018 through 2021.5 In the seven counties, there was strong growth in the number of home purchases by Black borrowers (both LMI and non-LMI), a situation that led to the Black homeownership rate increasing by 2 percentage points. However, the gap between Black and non-Black homeownership rates remains wide at 30.7 percentage points.
Historically low interest rates drove a surge of refinances, primarily for non-LMI, non-Black homeowners. But from 2020 through 2021, the number of refinances for Black and LMI homeowners increased at a faster rate than that of non-LMI, non-Black homeowners. With interest rates at historic lows, it is worth exploring why some homeowners choose not to refinance, particularly when refinancing a mortgage can save a homeowner thousands of dollars over the length of the mortgage. Recent studies uncovered several reasons: refinancing is a complex financial calculation, some homeowners are unaware of interest rate trends, some homeowners are suspicious of financial institutions’ motives, homeowners are often influenced by their neighbors’ refinancing actions, low-income borrowers are not solicited, and pandemic-related forbearance affected refinance rules. As mortgage interest rates have begun to rise, the refinance boom has subsided, and home sales have declined. It remains to be seen whether the upward trends will continue for Black and LMI borrowers seeking to purchase or refinance a home.
The views expressed in this report are those of the author(s) and are not necessarily those of the Federal Reserve Bank of Cleveland or the Board of Governors of the Federal Reserve System.
Footnotes
- The Federal Reserve’s Fourth District includes all of Ohio, western Pennsylvania, eastern Kentucky, and the northern panhandle of West Virginia. Return to 1
- In this report, Black refers to Black, non-Hispanic households and borrowers. Return to 2
- Low- and moderate-income (LMI) is defined as a median family income of less than 80 percent of the area median income (AMI). Conversely, non-LMI is defined as a median family income greater than or equal to 80 percent of the AMI. In this report, LMI and non-LMI refer to the borrower’s income. Return to 3
- Calculated as total Black home purchases divided by Black owner-occupied units then multiplied by 1,000. Return to 4
- Allegheny, Pennsylvania (Pittsburgh); Cuyahoga, Ohio (Cleveland); Fayette, Kentucky (Lexington); Franklin, Ohio (Columbus); Hamilton, Ohio (Cincinnati); Lucas, Ohio (Toledo); and Montgomery, Ohio (Dayton). Return to 5
References
- Agarwal, Sumit, Souphala Chomsisengphet, Hua Kiefer, Leonard C. Kiefer, and Paolina C. Medina. 2021. “Refinancing Inequality during the COVID-19 Pandemic.” Working paper 2021-08. FDIC Center for Financial Research. https://doi.org/10.2139/ssrn.3976961.
- Agarwal, Sumit, Richard J. Rosen, and Vincent Yao. 2016. “Why Do Borrowers Make Mortgage Refinancing Mistakes?” Management Science 62 (12): 3494–3509. https://doi.org/10.1287/mnsc.2015.2272.
- Bhutta, Neil, Aurel Hizmo, and Daniel Ringo. 2022. “How Much Does Racial Bias Affect Mortgage Lending? Evidence from Human and Algorithmic Credit Decisions.” FEDS working paper 2022-067. Board of Governors of the Federal Reserve System. https://doi.org/10.17016/FEDS.2022.067.
- Choi, Jung Hyun, and Amalie Zinn. 2022. “New Data Show Black and Latino Homeownership Rates Increased during the Pandemic.” Urban Institute. Urban Wire (blog). October 7, 2022. https://www.urban.org/urban-wire/new-data-show-black-and-latino-homeownership-rates-increased-during-pandemic.
- Freddie Mac. 2022. “30-Year Fixed Rate Mortgage Average in the United States.” FRED, Federal Reserve Bank of St. Louis. FRED, Federal Reserve Bank of St. Louis. 2022. https://fred.stlouisfed.org/series/MORTGAGE30US.
- Friedman, Nicole. 2020. “Millennials Help Power This Year’s Housing-Market Rebound.” Wall Street Journal, August 27, 2020, sec. Real Estate | Homes. https://www.wsj.com/articles/millennials-help-power-this-years-housing-market-rebound-11598520601.
- ———. 2021a. “Housing Market Stays Tight as Homeowners Stay Put.” Wall Street Journal, January 21, 2021, sec. WSJ News Exclusive | US. https://www.wsj.com/articles/housing-market-stays-tight-as-homeowners-stay-put-11611226802.
- ———. 2021b. “The Housing Market Is Crazier Than It’s Been Since 2006.” Wall Street Journal, April 3, 2021, sec. Real Estate. https://www.wsj.com/articles/the-housing-market-is-crazier-than-its-been-since-2006-11617422403.
- Gerardi, Kristopher S., Lauren Lambie-Hanson, and Paul S. Willen. 2021. “Racial Differences in Mortgage Refinancing, Distress, and Housing Wealth Accumulation during COVID-19.” 92793. Current Policy Perspectives. Federal Reserve Bank of Boston. https://ideas.repec.org/p/fip/fedbcq/92793.html.
- Gerardi, Kristopher S., Paul S. Willen, and David Hao Zhang. 2020. “Mortgage Prepayment, Race, and Monetary Policy.” Working paper 2020-22. Federal Reserve Bank of Atlanta. https://ideas.repec.org/p/fip/fedawp/89454.html.
- Johnson, Eric J., Stephan Meier, and Olivier Toubia. 2019. “What’s the Catch? Suspicion of Bank Motives and Sluggish Refinancing.” The Review of Financial Studies 32 (2): 467–95. https://doi.org/10.1093/rfs/hhy061.
- Keys, Benjamin J., Devin G. Pope, and Jaren C. Pope. 2016. “Failure to Refinance.” Journal of Financial Economics 122 (3): 482–99. https://doi.org/10.1016/j.jfineco.2016.01.031.
- Khater, Sam, Len Kiefer, and Venkataramana Yanamandra. 2021. “Housing Supply: A Growing Deficit.” Research Note. Freddie Mac. https://www.freddiemac.com/research/insight/20210507-housing-supply.
- Ky, Kim-Eng, and Katherine Lim. 2022. “The Role of Race in Mortgage Application Denials.” Working paper. Community Development Report. Federal Reserve Bank of Minneapolis. https://www.minneapolisfed.org/research/community-development-papers/the-role-of-race-in-mortgage-application-denials.
- Liu, Feng, Young Jo, and Eileen Chen. 2022. “Data Point: 2021 Mortgage Market Activity and Trends.” Research Reports Series 7. Consumer Financial Protection Bureau. https://files.consumerfinance.gov/f/documents/cfpb_data-point-mortgage-market-activity-trends_report_2022-09.pdf.
- McCartney, W. Ben, and Avni M. Shah. 2022. “Household Mortgage Refinancing Decisions Are Neighbor Influenced, Especially along Racial Lines.” Journal of Urban Economics 128 (March): 103409. https://doi.org/10.1016/j.jue.2021.103409.
- Popick, Stephen J. 2022. “Did Minority Applicants Experience Worse Lending Outcomes in the Mortgage Market? A Study Using 2020 Expanded HMDA Data.” Working paper 2022-05. FDIC Center for Financial Research. https://doi.org/10.2139/ssrn.4131603.
Suggested Citation
Klesta, Matt. 2022. “Home Mortgage Lending by Race and Income in a Time of Low Interest Rates: Examples from Select Counties in Kentucky, Ohio, and Pennsylvania from 2018 through 2021.” Federal Reserve Bank of Cleveland, Community Development Reports. https://doi.org/10.26509/frbc-cd-20221129
- Share