

Providing Labor Market Context for Debt-Related Driver’s License Suspensions in Ohio
More than 60 percent of Ohio’s driver’s license suspensions do not stem from bad driving; instead, they arise because the driver owes an unpaid debt. Debt-related suspensions (DRS) could prevent people from getting to work where they could make the money needed to repay the debt. In this report, we investigate whether DRS has implications for Ohio’s labor force.
Introduction
Most driver’s license suspensions in Ohio do not stem from reasons relating to being a bad driver. In fact, over 60 percent of Ohio’s driver’s license suspensions arise because the driver owes a debt that has not been paid. We label these debt-related suspensions (DRS).
According to a report by the Legal Aid Society of Cleveland, in an average year, over 1.7 million Ohio drivers have over 3.2 million active debt-related suspensions, indicating that drivers often face more than one DRS at a time. While DRS are over-represented in Ohio’s central cities, DRS are a problem throughout the state—60 percent of all suspensions are on drivers outside of Ohio’s central cities. The financial implications of DRS are substantial. From 2016 through 2020, the Ohio Bureau of Motor Vehicles (BMV) and third-party creditors levied an average of about $150 million in charges and fees related to DRS, but drivers only paid about $33 million per year during that period. The unpaid amount accumulates over time, averaging about $922 million during those five years.1 Furthermore, DRS are much more frequently found in high poverty and minority communities.
Individuals with a DRS are not legally allowed to drive anywhere, even to work. This could prevent people from getting to the place where they could make the money needed to repay the debt and have their license reinstated. It also could prevent them from getting a new job that requires a driver’s license.
In this report, we investigate whether DRS has implications for Ohio’s labor force. However, accurately estimating those implications is quite difficult based upon the available data. Instead, we provide labor market context for DRS on two dimensions. First, we use two hypothetical scenarios based on the share of people in the labor force that comply with DRS or not to illustrate risks of DRS. Second, we investigate how often a valid driver’s license is requested by employers in online job postings.
Key findings:
- DRS have the potential to significantly impact Ohio’s labor force. For example, if just half of those with a DRS were to comply, the impact statewide could result in a potential loss of over 830,000 working or work-seeking individuals from the labor force.
- The share of jobs ads requesting a driver’s license in Ohio (14.0 percent) is higher than the national average (10.6 percent) in 2022 and has increased 10 percent faster than the national average from 2015 to 2022.
- The share of job ads requesting a driver’s license varies significantly by industry and by geography, indicating that some portions of Ohio’s economy have the potential to be more impacted by DRS than others. For instance, the percent of jobs requiring a driver’s license increases as you move from core urban areas to the metropolitan fringe and is highest in nonmetropolitan Ohio.
- Lower- and middle-wage occupations tend to have the highest rates of job ads requesting a driver’s license. This indicates that DRS can be more problematic for hiring into middle- and lower-wage occupations and suggests that a driver’s license is important for one’s economic mobility in the lower half of the wage distribution.
Data
The DRS data were obtained via a public records request to the Ohio BMV. We obtained a count of all driver’s license suspensions, as well as detailed financial information about eight types of suspensions that we determined to be debt related. The data were aggregated and provided at the zip code level for the years 2016–2020. To analyze the DRS data relative to Ohio population, demographic, and employment data, we matched the DRS zip codes to the Census Bureau equivalent: Zip Code Tabulation Areas (ZCTAs).
In addition, this analysis uses data on Ohio’s labor force, industrial composition, and occupations from the Bureau of Labor Statistics. Information on Ohio’s job ads comes from Lightcast and is aggregated to produce annual estimates of the share of job ads asking for a driver’s license.2
Two Hypothetical Labor Force Scenarios
Resulting in over 1.7 million licenses suspended annually, DRS have the potential to significantly impact Ohio’s labor force. However, the available data is lacking a few key inputs to precisely estimate those impacts. At the most basic level, for those receiving a DRS, we do not know if they were employed, if they were looking for work, how likely they were to disregard the suspension and keep driving, if they could get to work without driving, and the length of suspension. Given these limitations, we use labor market information to conduct two hypothetical scenarios to illustrate the risks of DRS to Ohio’s labor force. Each scenario is based on upon the share of the labor force that is subject to a binding DRS shock, in which they abide by the suspension and cannot get to or look for work, so they end up leaving the labor force. As mentioned above, we do not know how likely someone is to abide by the suspension and not drive, so we present a scenario in which half of those receiving a DRS comply with the suspension and another scenario in which all of those receiving a DRS comply with the suspension.
To help introduce these scenarios, let us first consider the share of the labor force that is at risk of a DRS in this framework. In 2020, the 1.66 million DRS would equate to 28.9 percent of Ohio’s labor force at risk of receiving a DRS (Table 1). Accordingly, it is probably best to consider the estimates in Table 1 and the two scenario tables (Tables 2 & 3) to be upper bounds for percent of labor force at risk as it is possible that not all those with a DRS are in the labor force or require driving to the workplace. Relatedly, while each scenario as presented refers to the potential labor force declines from a binding DRS, one could just as easily examine potential gains from removing a hypothetical binding DRS policy that is keeping 1.66 million Ohioans out of the labor force. Furthermore, the labor force impacts are more likely to touch those in poor and nonwhite communities as they are more likely to have received a DRS.
Table 1: Ohio's Labor Force at Potential Risk of DRS
| Labor Force | |
| 2020 | 5,752,792 |
| # at risk of DSR | 1,660,000 |
| % at risk of DSR | 28.9% |
| 2020 – Rate | 61.6% |
Source: Bureau of Labor Statistics, Ohio BMV.
In the first scenario, half of the DRS are binding, which means that half of those receiving a DRS comply with the suspension, and they end up leaving the labor force because they are unable to get to or look for work without a driver’s license. In this scenario, 830,000 workers (14.4 percent) end up leaving the labor force, effectively lowering the labor force participation rate by almost 9 percentage points, from 61.6 percent to 52.7 percent (Table 2). Based upon these numbers, there are potentially significant labor force impacts if only half of those receiving a DRS comply with the suspension.
Table 2: Scenario 1: Labor Force Impacts if Half with DRS Leave the Labor Force
| Labor Force | |
| 2020 | 5,752,792 |
| # leaving LF due to DSR | 830,000 |
| % leaving LF due to DSR | 14.4% |
| 2020 – Rate | 61.6% |
| Estimated Rate | 52.7% |
Source: Bureau of Labor Statistics, Ohio BMV.
In the more severe second scenario, all those receiving a DRS comply with the suspension. Under this scenario, almost a third of the labor force is impacted by a DRS and leave the labor force, lowering the labor force participation rate by 18 percentage points to 43.7 percent (Table 3). The potential impacts from this scenario would cause a significant slowdown in economic activity as roughly only two out of every five working age Ohioans would be in the labor force.
Table 3: Scenario 2: Potential Impacts if All with DRS Leave the Labor Force
| Labor Force | |
| 2020 | 5,742,446 |
| # leaving LF due to DSR | 1,660,000 |
| % leaving LF due to DSR | 28.9% |
| 2020 – Rate | 61.6% |
| Estimated Rate | 43.7% |
Source: Bureau of Labor Statistics, Ohio BMV.
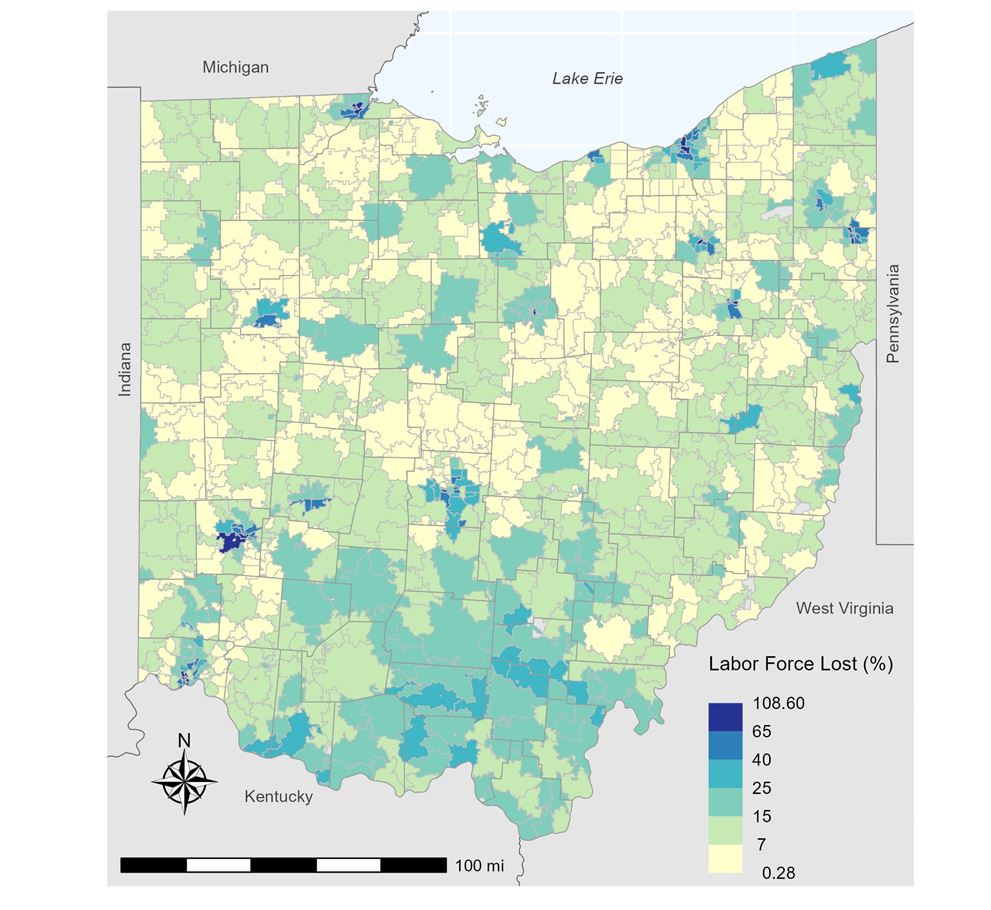
Because DRS are not evenly distributed throughout the state, neither would be the withdrawals from the labor force due to DRS. Figure 1 shows the geographic implications of Scenario 1 where half of all individuals with a DRS would leave the labor force.
Data source: LEHD Origin-Destination Employment Statistics
https://lehd.ces.census.gov/data/#lodes and Lightcast
It stands out immediately that even in this scenario where only half of the DRS holders left the workforce, losses would be substantial statewide. The median ZCTA would stand to lose over 9 percent of its labor force, while fully one quarter would lose over 15 percent. Seventeen ZCTAs would lose more than 65 percent of their labor force in this scenario, and these tend to be in core urban areas with larger work forces. In three ZCTAs (44702: Canton, 44503 and 44507: Youngstown) half of the DRS population exceeds the labor force so that in this scenario, these locations would lose their entire labor force. While there are certainly pockets that would lose less than 7 percent, the elevated rates in urban areas, and rates commonly ranging from 7 percent to 40 percent in the south, southeast, and north central portions of the state are notable.
Driver’s License Requirements in Job Ads
Next, we investigate how often a valid driver’s license is included in online job postings to see how DRS could potentially impact hiring activity in Ohio. The share of job ads requesting a driver’s license provides insights into how likely a driver’s license is a barrier to employment for those without a valid one. To be clear, a driver’s license is a necessary and important requirement for employment in occupations that require the transportation of goods and services that are inherent to the job. However, we know employer requirements for hiring do not always align with what is required to perform the occupation and can change overtime, especially when it comes to education.3 Similar to a college degree, employers with limited information about candidates could use a driver’s license as a signal of employability. A lack of a driver’s license becomes a barrier to hiring/employment when it artificially screens out candidates that would qualify otherwise.
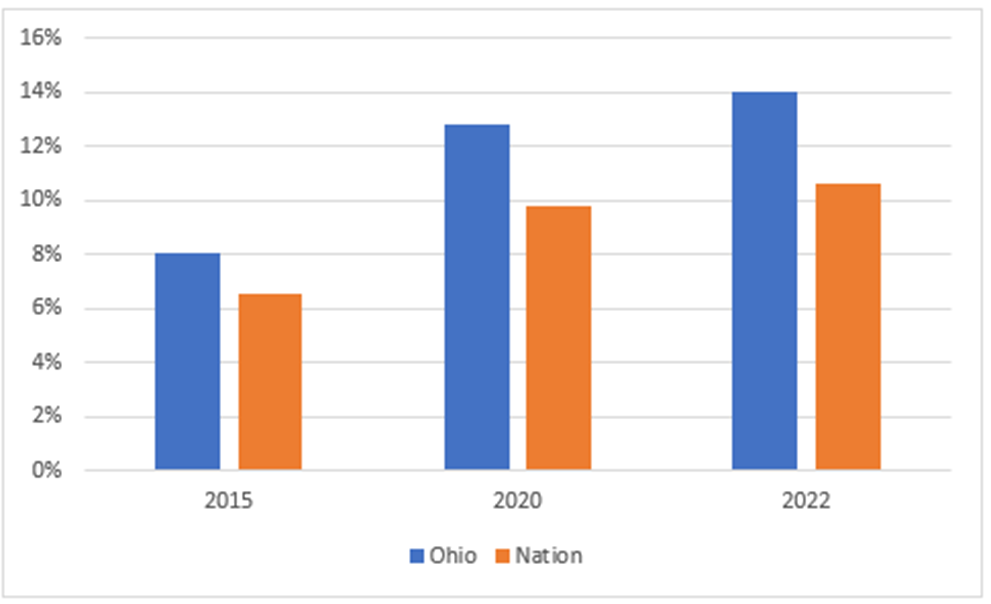
Two observations stand out when comparing the share of job ads requesting a driver’s license in Ohio and the nation since 2015 (Figure 2). First, driver’s license requirements are more common in Ohio than the national average. The share of ads requesting a driver's license is roughly 25 percent higher in Ohio than the national average. In 2022, 14 percent of Ohio’s job ads requested a driver's license compared to the national average of 10.6 percent of job ads. Second, driver’s license requirements have become more common since 2015 with growth in Ohio larger than the national average. Ohio’s share grew 5.9 percentage points (74.0 percent) compared to the national average growth of 4.1 percentage points (63.4 percent). Together these observations likely reflect Ohio’s industrial composition rather than Ohio’s employers requesting a driver’s license when it is not needed. However, they also indicate that DRS can limit the supply of workers available for hire and has increasingly done so since 2015.
Source: Lightcast.
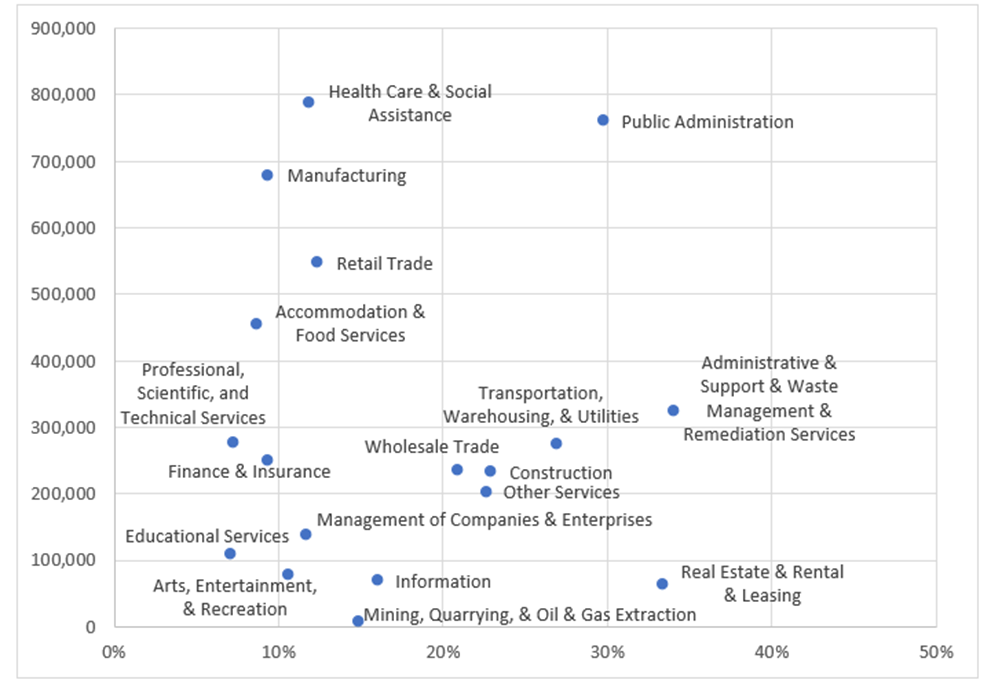
A closer look at the share of job ads requesting a driver’s license reveals significant variation across Ohio’s industrial sectors (Figure 3). On the higher end of the spectrum, waste management and remediation services, construction, real estate, rental and leasing, public administration, and transportation, warehousing, and utilities all have more than 20 percent of job ads requesting a driver’s license. While some of these are expected to have a high concentration based on the nature of the work, public administration stands out as a large sector, employing over 760,000 workers, with a high incidence of asking for a driver’s license (29.7 percent of job ads). Furthermore, while not shown, the share of public administration job ads requesting a driver's license increased over 100 percent from 2015 to 20224.
On the low end, manufacturing, accommodation and food services, professional, scientific, and technical services, finance and insurance, and educational services all have less than 10 percent of job ads requesting a driver's license. Two other large sources of employment—retail trade as well as health care and social assistance—each have about 12 percent of job ads requesting a driver's license. This data indicates that some industrial sectors are more susceptible to DRS than others, with the public sector as one area that is especially at risk of DRS and has seen that risk increase markedly since 2015.
Source: Lightcast and Bureau of Labor Statistics.
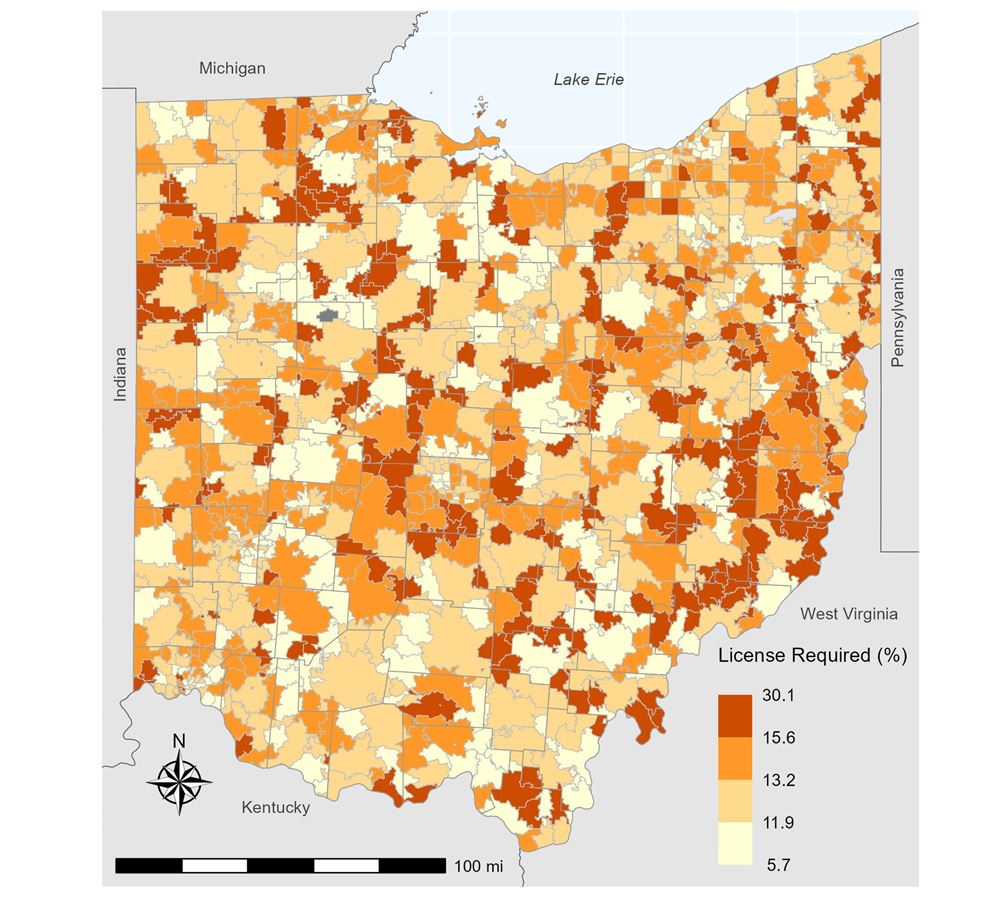
How these patterns play out geographically depends on each zip code’s mix of sector employment, and the degree to which each sector requires a driver’s license as a condition of employment. To create Figure 4, below, each zip code’s employment in each sector was multiplied by the proportion of jobs requiring a driver’s license. The result is the number of jobs in each sector requiring a driver’s license, which was then summed to a total. The percent of all jobs requiring a driver’s license is mapped. These figures assume that the driver’s license requirements of job ads in each sector apply to all of the current jobs in that sector.
Data source: LEHD Origin-Destination Employment Statistics
https://lehd.ces.census.gov/data/#lodes and Lightcast
The spatial pattern is quite telling. First, in and around Ohio’s metropolitan areas, the percent of jobs requiring a license steadily increases as one moves from the core to the periphery. Non-metropolitan Ohio has some of the highest rates of jobs requiring a driver’s license, indicated by the darkest orange in Figure 4. Although these areas had more moderate labor force loss, they are also quite probably more auto dependent. Transit is unlikely to serve as a viable substitute for a driver’s license in these areas, leading either to accelerated labor force loss or increased driving with a suspended license, risking additional suspensions, fines, fees, and incarceration.
There is also significant variation in the share of job ads with a driver’s license across occupations. In 2022, 247 out of 815 occupations had over 20 percent of job postings requesting a driver’s license whereas 100 occupations did not have any job postings requesting a driver’s license. As mentioned above, a driver’s license is a necessary and important requirement for employment in some occupations but may not be for others. For example, 72 percent of job ads for a delivery driver ask for a driver’s license compared to just 3 percent of job ads for accountants and auditors. But there are also examples of occupations that you might not expect to ask for driver’s license but do so at a relatively high rate; for instance, 22 percent of job ads for janitors and cleaners and 19 percent of job ads for food service managers are looking for a driver’s license.
Across all of Ohio’s occupations, lower- and middle-wage occupations tend to have the highest rates of job ads requesting a driver’s license (Table 4). In fact, only 10.9 percent of jobs ads for the highest wage occupations (more than $79,400) request a driver’s license compared to 25.9 percent of job ads for occupations in the middle of the wage distribution ($48,000 to $60,000). This relationship between wages and job ads requesting a driver’s license indicates that DRS can be more problematic for hiring into middle- and lower-wage occupations and suggests that a driver’s license is important for one’s economic mobility in the lower half of the wage distribution. Those workers would have a more difficult time meeting the financial burden associated with a DRS.
Table 4: Average Annual Median Wage Occupation Quintiles and Share of Job Ads Requesting a Driver’s License, 2022
| Quintile | Annual Median Wage | Share of Job Ads* |
| 1 | Less than $39,500 | 13.3% |
| 2 | $39,501 to $48,000 | 15.8% |
| 3 | $48,001 to $60,000 | 25.9% |
| 4 | $60,001 to $79,400 | 12.6% |
| 5 | Greater than $79,400 | 10.9% |
Source: Lightcast, Bureau of Labor Statistics. * Employment weighted average.
Conclusion
Debt-related driver’s license suspensions are often viewed from a broader “fines and fees” perspective, calling attention to the financial burden they place on individuals, frequently initiating a cycle of debt that is difficult to escape. Our goal was not to focus on these individual consequences, but rather to provide labor market context for Ohio suspending drivers’ licenses for owing a debt—not for reasons related to driving.
Based on our analysis, over 830,000 Ohioans could be at risk of leaving the labor force if only half of drivers with a DRS abided by its terms. That equates to 14.4 percent of the labor force. Metropolitan labor markets would be hit the hardest by the labor force exodus, along with nonmetropolitan areas in southern Ohio. Compared to the nation, Ohio’s new jobs more often require a driver’s license, and the requirement is increasing. It is becoming more common, across almost all sectors, for a driver’s license to be required as a condition of employment. This is particularly so in suburban, exurban, and rural economies, reflecting the mobility challenges present in areas that are not well served by public transit. Furthermore, employer driver’s license requirements tend to be highest in middle- and lower-wage occupations, indicating the importance of a driver’s license to this segment of the workforce while highlighting how a lack of driver’s license can be a barrier to economic mobility for those most at risk of receiving a DRS.
Our analysis suggests that these suspensions, especially when combined with increasing driver’s license requirements, make finding and maintaining employment more difficult for a sizable portion of Ohioans, but that instability also affects the broader economy. Fewer people in the labor force means fewer people to hire and fewer people to produce and consume goods and services.
The views expressed in this report are those of the author(s) and are not necessarily those of the Federal Reserve Bank of Cleveland or the Board of Governors of the Federal Reserve System.
Footnotes
- Sweeney, Anne K., Michael S. Russell, Julie K. Rovie, and Brian Mikelbank. 2022. “Road to Nowhere: Debt-Related Driver’s License Suspensions in Ohio.” The Legal Aid Society of Cleveland. https://lasclev.org/roadtonowherereport/. Return to 1
- Lightcast collects data from over 51,000 sources daily, including job boards, company websites, and other sources. Natural language processing technology, other artificial intelligence tools, and in-house experts extract over 70 different elements from each job posting. Return to 2
- Fee et al, 2019 find employer educational requirements change over the business cycle.
Fee, Kyle D., Lisa A. Nelson, and Keith Wardrip. 2019. “Opportunity Occupations Revisited: Exploring Employment for Sub-Baccalaureate Workers across Metro Areas and over Time.” Community Development Report. Federal Reserve Bank of Cleveland, Federal Reserve Bank of Philadelphia. https://www.clevelandfed.org/community-development/opportunity-occupations/oo-20190401-employment-for-subbaccalaureate-workers. Return to 3 - Growth was broad based across occupations with some larger changes in criminal justice related occupations (correctional officers, detectives and security guards). Return to 4
Suggested Citation
Fee, Kyle D., and Brian A. Mikelbank. 2024. “Providing Labor Market Context for Debt-Related Driver’s License Suspensions in Ohio.” Federal Reserve Bank of Cleveland, Community Development Reports. https://doi.org/10.26509/frbc-cd-20240228
This work by Federal Reserve Bank of Cleveland is licensed under Creative Commons Attribution-NonCommercial 4.0 International


- Share
RElated content

Multimedia infographic
This report's key findings and key numbers are highlighted in this companion piece, "Too much debt to drive? How Ohio’s debt-related license suspensions could affect the labor force."