

How Insured Are Workers Against Unemployment? Unemployment Insurance and the Distribution of Liquid Wealth
In this Economic Commentary, we analyze the relationship between unemployment insurance (UI) recipiency and insurance by examining the wealth distribution of workers who have been through an unemployment spell. We focus on the net liquid wealth gap between recipients and nonrecipients of UI along the income distribution of the unemployed. Using recent data from the Survey of Income and Program Participation at the individual level, we estimate that UI recipients at the bottom half of the income distribution tend to have higher median net liquid wealth than nonrecipients, putting nonrecipients in a potentially vulnerable economic position during periods of unemployment.
Replication codes for this paper are available at https://github.com/avdluduvice/LuduviceTruss-Williams_UI.
The views authors express in Economic Commentary are theirs and not necessarily those of the Federal Reserve Bank of Cleveland or the Board of Governors of the Federal Reserve System. The series editor is Tasia Hane. This paper and its data are subject to revision; please visit clevelandfed.org for updates.
Introduction
During times of rising unemployment or labor market deterioration, unemployment insurance (UI) is a main component of the employment safety net available to US workers. The share of UI recipients in the labor force is highly countercyclical, rising in recessions and falling in macroeconomic expansions (Chodorow-Reich and Coglianese, 2019). UI works, then, as an automatic stabilizer of economic activity, providing benefit payments that serve as a financial cushion for eligible unemployed workers and replacing a fraction of their past earnings for a determined period, usually measured in weeks.
Key components of UI design are its eligibility requirements. UI recipiency rates—that is, the rates of UI-eligible applicants who apply and subsequently receive UI benefits—are typically low for eligible workers, leaving them in a potentially vulnerable position during economic downturns (Forsythe and Yang, 2021). Furthermore, unemployed workers tend not to have enough liquid wealth to financially self-insure against jobless spells (Birinci, 2020), and workers who are ineligible for UI are more likely to be in poverty than are UI-eligible workers (Michaud 2023; Horwich, 2023). With low UI recipiency rates and lower levels of liquidity and asset resources for rainy days, many workers may be financially vulnerable when facing the burden of unemployment.
In this Economic Commentary, we analyze the relationship between UI recipiency and economic insurance among the unemployed with a focus on unemployed workers’ wealth distribution. We do so in three parts: (i) a short discussion of the aggregate data on UI recipients, (ii) details of the eligibility criteria for UI and a review of recent economic literature on the impact of such requirements on UI recipiency, and (iii) an empirical analysis to assess the financial vulnerability of workers to unemployment spells by documenting the distribution of income and net liquid wealth—assets that are readily available, akin to cash, minus any short-term debt—of workers who experienced unemployment.
In our empirical analysis, we focus our attention on the differences between recipients and nonrecipients of UI among workers who have been through an unemployment spell at some point in the previous year. We use recent data from the Survey of Income and Program Participation (SIPP) to construct a sample that approximates the pool of unemployed workers who could be eligible for UI recipiency.1 We then analyze how personal net liquid wealth is distributed depending on the recipiency status of UI along our sample’s income distribution. We find that at the bottom half of the income distribution, UI recipients tend to have more wealth than nonrecipients, putting nonrecipients in a particularly vulnerable position during jobless spells. Our findings suggest that the reach of UI recipiency may be missing some of the most vulnerable workers when it comes to assisting them in insuring against the ramifications of unemployment.
Unemployment and Insurance
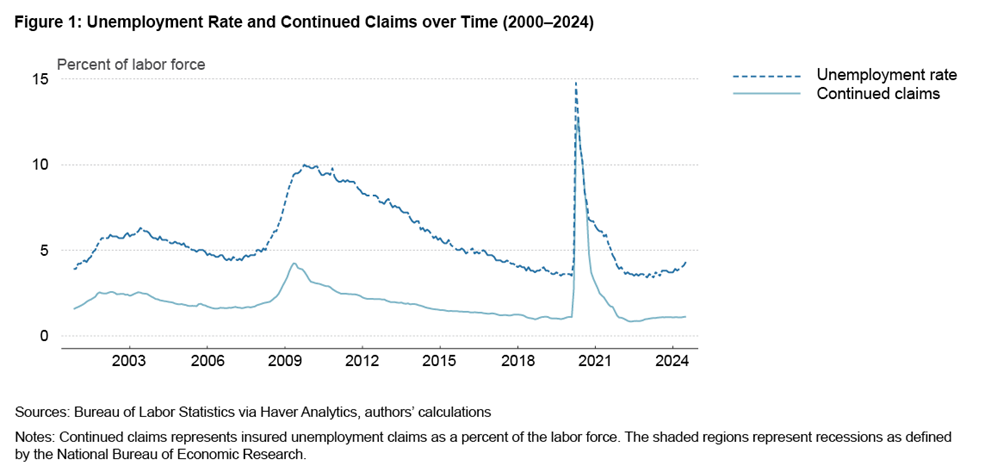
To understand the overall efficacy of UI in insuring workers, we start by looking at the time series of aggregate data on unemployment and UI recipients. In Figure 1, we show the unemployment rate (UR) and continuing claims as a fraction of the labor force, also known as the “insured unemployed.” The comparison between the UR and continuing claims allows us to gauge the overall reach of UI by pinning down the proportion of currently insured workers, with regular benefits, relative to the pool of unemployed workers.
In Figure 1, we observe that the unemployment rate has recently been at a historically low level in the United States after a pronounced jump in April 2020 at the start of the pandemic. Despite low unemployment, the gap between the pool of unemployed workers and those who receive UI remains largely unchanged.2 On average and at an aggregate level, approximately 35 percent of workers were insured from 1989 through 2012 (Auray et al., 2019), and less than 30 percent of unemployed workers were insured by UI from 2010 to 2020.
UI Eligibility and Recipiency
To understand the characterization of the gap between the pool of unemployed and those insured, we need to take a more focused look into eligibility requirements to receive UI benefits. A critical part of the design of UI is that not all workers are eligible to receive benefits. First, a worker must be laid off through no fault of their own and cannot claim UI if they quit their job voluntarily. Second, UI rules require that workers are not self-employed, and this requirement excludes, for example, participants of the “gig economy” (Horwich, 2023). The final and most restrictive step is that workers need to qualify according to details of their employment history. Workers in general need to show a combination of a working tenure of a certain duration and the receipt of wages or earnings that are above a specific value in a given time period, often called the “base period.”3 These values vary by state and are collected in summary tables by the US Department of Labor (USDOL).4
Eligibility standards matter for UI recipiency, and these rules are complex, with tenure and monetary requirements that vary substantially across states and have varied over the years (de Souza and Luduvice, 2023). The economic literature examines the relationship between requirements and UI recipiency, with recent papers emphasizing its relevance. Auray et al. (2019), for example, estimate that approximately 55 percent of unemployed workers are ineligible because do not meet one or more requirements for UI recipiency. Michaud (2023) calculates that workers in ineligible jobs account for 25 percent of employed US workers. Chao (2023) finds that 10 percent of UI applications were rejected because workers failed the earnings requirement. With a focus on the adoption of requirements by states, de Souza and Luduvice (2023) find that the introduction of a monetary requirement decreases the share of UI recipients by 2.5 percent. Finally, Chao et al. (2022) find that eligibility on earnings increases quarterly reemployment earnings by 10 percent.
Going deeper, another crucial measurement when it comes to UI recipiency is the take-up rate (TUR). This rate measures the share of recipients relative only to those who are eligible to receive the benefits. In a comprehensive report, Forsythe and Yang (2021) provide an in-depth analysis of UI eligibility and the disparities related to its recipiency. The authors mention that there are limitations with self-reported UI recipiency in surveys, a common element among many studies, including our analysis in this text, and hence the actual rates of recipiency could be higher.5 The authors find that when restricting their sample to those eligible based on nonmonetary requirements, around 27 percent of workers receive UI. Conditional on the more restrictive share of those eligible by the monetary requirement, the recipiency ratio climbs up to 39 percent.6 We summarize some of their numbers in Table 1.
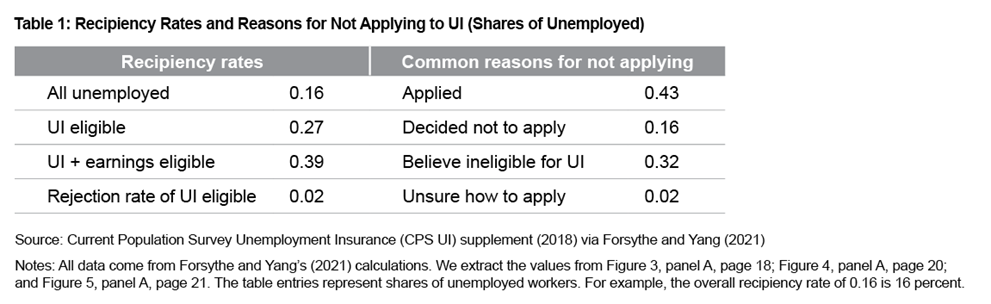
Auray et al. (2019) find that, on average, 23 percent of those who are eligible do not take-up UI. We can refer to Table 1, in which we observe that Forsythe and Yang (2021) find that among the workers who were earnings eligible, 57 percent never applied. So why do workers not claim UI benefits even if they are eligible under a restrictive condition? Of the reasons given for not applying, 32 percent of the eligible said they thought they were ineligible, while 16 percent believed they were eligible but decided not to apply for a reason other than believing themselves ineligible. There is also substantial heterogeneity on eligibility when it comes to their income and wealth. Birinci and See (2023) document UI eligibility and take-up along the income and wealth distribution and find that workers at the higher quintiles of the asset-to-income ratio distribution have lower TUR than those in bottom quintiles.
UI Recipiency and Inequality
We now further assess UI’s efficacy in providing insurance to workers by measuring the capacity of insured and noninsured workers to weather economic shocks; that is, we measure their readily available wealth and how it is distributed along the income distribution. To study the differentials in wealth between recipients and nonrecipients in UI, we focus on a specific concept of wealth: net liquid wealth. We consider net liquid wealth, or readily available wealth, assets such as funds in checking accounts, equity in stocks and mutual funds, equity in vehicles, and so on. To make it “net,” we subtract the value of total outstanding debt in credit cards to account for short-term debt that affects immediate liquidity.
We use data from the 2018–2023 waves of the SIPP. The initial sample selection comprises workers who were from 24 through 64 years old and had nonnegative annual earnings in the reference year of the survey sampling. We use this sample to rank all workers along the personal annual income distribution. To analyze UI recipiency, within this sample we exclude workers who were self-employed, and we focus solely on workers who have been laid off and are either looking for work or received only regular government-provided UI or both in any month in the reference year.7,8 All data are shown in December 2017 dollars.9
Figure 2 shows the median annual income of unemployed workers in our sample divided between those who ever received UI at a given month and those who never received UI in the reference year. We plot these along the quartiles of the general income distribution. In our initial sample, the median annual personal income adjusted to 2017 dollars is $35,837.10
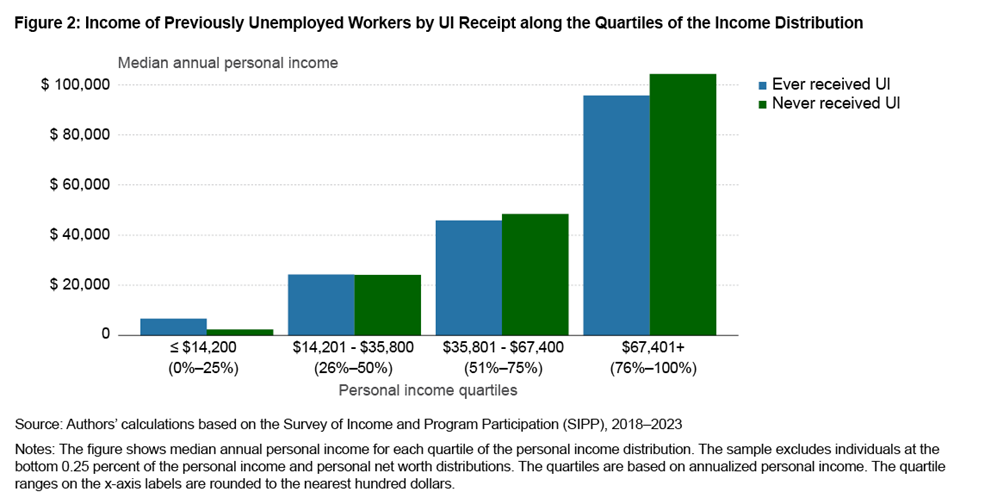
We observe no remarkable difference in the median income between recipients and nonrecipients of UI in the middle quartiles of the income distribution. At the top quartile, the median income of those who have never received UI is about 9 percent higher than the median income of UI recipients. Conversely, at the bottom 25 percent of the income distribution, UI recipients have, albeit small, almost three times the median income of those who have never received UI. Given that these workers need a minimum set amount of earnings to qualify for UI, this is to be expected. Moreover, this is a group for which the share of the UI benefit on their income is sizable, and total income accounts for all sources of income, including UI benefits and other transfers. Furthermore, as our sample focuses on workers who have been through an unemployment spell, it is also expected for nonrecipients of UI at the bottom of the income distribution to have a moderate amount of total personal income.
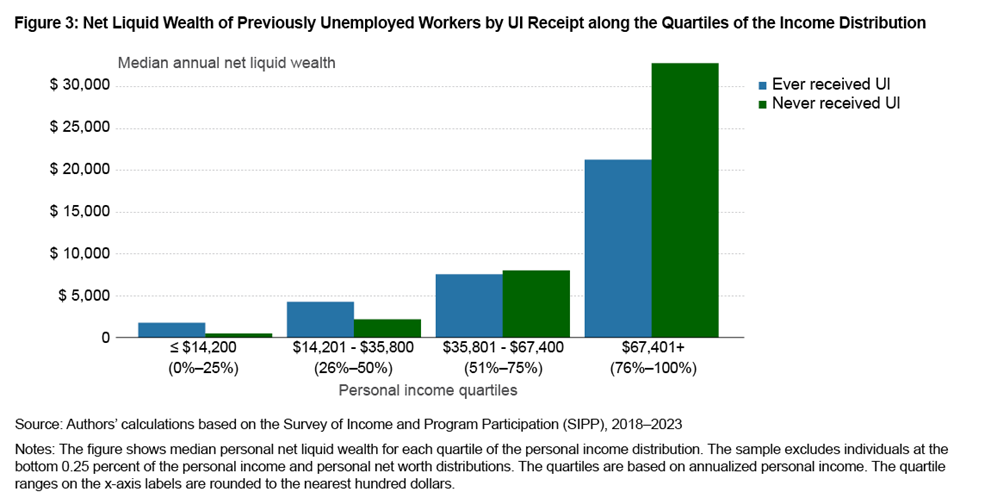
Figure 3 shows the distribution of net liquid wealth for recipients and nonrecipients of UI along the income distribution. Different from income, which is relatively evenly distributed, there is now a more consistent differential along the income distribution: at the two bottom quartiles, workers who have received UI at least once in the past year have a higher median net liquid wealth than those who have never received UI, whereas at the top quartile, nonrecipients have notably more median net liquid wealth than UI recipients.
At the bottom half of the income distribution, recipients' median net liquid wealth is 2.5 times the median of nonrecipients. Breaking it down into quartiles, we observe that at the second quartile, UI recipients have roughly two times more net liquid wealth than nonrecipients and the bottom 25 percent have almost 3.7 times the median amount of readily available savings. These differences highlight how some recipients are potentially much better insured for enduring an unemployment spell.
In Figure 4 of Appendix 3, we show the same graph but for total net worth and find a similar pattern at the bottom of the income distribution.
There could be several potential reasons why this pattern emerges and different likely directions in the paths of causality. One potential reason is that unemployed workers who did not receive UI in the previous year had no other option but to use their savings when faced with an unemployment spell, while UI recipients were potentially able to keep their readily available resources at a higher level and required less cash withdrawal to sustain their usual level of consumption and spending. In another possible direction, we might also surmise that the earning requirement poses an eligibility constraint for workers at the bottom of the income distribution to be eligible for UI, as previously discussed. Thus, workers who have at some point received UI would be those who have, on average, higher earnings than those who never received UI and hence were able to accumulate and sustain a higher net worth and, therefore, a higher level of net liquid wealth.
The determination of any path of causality is beyond the scope and purpose of our analysis and exercise; moreover, it is also beyond limitations of the choices made in the definition of our data sample. One critical issue, among many others, is that, as mentioned in our data construction, we do not consider the precise timing of the unemployment spell faced by workers in our sample nor how this spell is related to their choice of whether to rely on their savings during unemployment. The determination of potential causality, its direction, and the mechanisms involved are relevant aspects of a more detailed analysis of the topic, one which we leave for future research and discussion.
References
- Auray, Stéphane, and David L. Fuller. 2020. “Eligibility, Experience Rating, and Unemployment Insurance Take‐up.” Quantitative Economics 11 (3): 1059–1107. https://doi.org/10.3982/QE940.
- Auray, Stéphane, David L. Fuller, and Damba Lkhagvasuren. 2019. “Unemployment Insurance Take-up Rates in an Equilibrium Search Model.” European Economic Review 112 (February): 1–31. https://doi.org/10.1016/j.euroecorev.2018.11.005.
- Birinci, Serdar. 2020. “Unemployment Insurance and Vulnerable Households During the COVID-19 Pandemic.” Economic Synopses 2020 (33). https://doi.org/10.20955/es.2020.33.
- Birinci, Serdar, and Kurt See. 2023. “Labor Market Responses to Unemployment Insurance: The Role of Heterogeneity.” American Economic Journal: Macroeconomics 15 (3): 388–430. https://doi.org/10.1257/mac.20200057.
- Chao, Ying. 2023. “A Quantitative Analysis of Relaxing UI Eligibility Requirements: Evidence from the Pandemic Unemployment Assistance.” Working paper. https://drive.google.com/file/d/1Ni_DsowiBwX2kUVbTvE8t_Tg-g-Pux5C/view.
- Chao, Ying H., Benjamin S. Griffy, and David Wiczer. 2022. “The Effect of Unemployment Insurance Eligibility in Equilibrium.” Working paper. https://drive.google.com/file/d/1fWmF8ZJXT8xzvjgNBkigvbwkeMvv3r99/view.
- Chodorow-Reich, Gabriel, and John Coglianese. 2019. “Unemployment Insurance and Macroeconomic Stabilization.” In Recession Ready: Fiscal Policies to Stabilize the American Economy, edited by Heather Boushey and Jay Shambaugh, 153–179. The Hamilton Project, Brookings Institution. https://www.hamiltonproject.org/publication/policy-proposal/unemployment-insurance-and-macroeconomic-stabilization/.
- Cortes, Guido Matias, and Eliza Forsythe. 2023. “Distributional Impacts of the Covid-19 Pandemic and the CARES Act.” The Journal of Economic Inequality 21 (2): 325–349. https://doi.org/10.1007/s10888-022-09552-8.
- de Souza, Gustavo, and André Victor D. Luduvice. 2023. “Optimal Unemployment Insurance Requirements.” Working paper 22-10R. Federal Reserve Bank of Cleveland. https://doi.org/10.26509/frbc-wp-202210r.
- Forsythe, Eliza, and Hesong Yang. 2021. “Understanding Disparities in Unemployment Insurance Recipiency.” Working paper. https://www.dol.gov/sites/dolgov/files/OASP/evaluation/pdf/University%20of%20Illinois%20-%20Final%20SDC%20Paper.pdf.
- Greig, Fiona, Daniel M. Sullivan, Samantha Anderson, Peter Ganong, Pascal Noel, and Joseph Vavra. 2022. “Lessons Learned from the Pandemic Unemployment Assistance Program during COVID-19.” JPMorgan Chase Institute. https://papers.ssrn.com/sol3/papers.cfm?abstract_id=4100569.
- Horwich, Jeff. 2023. “Should People with Limited Work History Qualify for Unemployment Insurance?” Federal Reserve Bank of Minneapolis. https://www.minneapolisfed.org/article/2023/should-people-with-limited-work-history-qualify-for-unemployment-insurance.
- Lachowska, Marta, Isaac Sorkin, and Stephen A. Woodbury. 2022. “Firms and Unemployment Insurance Take-Up.” Working Paper 30266. National Bureau of Economic Research. https://doi.org/10.3386/w30266.
- Michaud, Amanda. 2023. “Expanding Unemployment Insurance Coverage.” Institute Working Paper 67. Opportunity and Inclusive Growth Institute, Federal Reserve Bank of Minneapolis. https://doi.org/10.21034/iwp.67.
- O’Leary, Christopher J., Kenneth J. Kline, Thomas A. Stengle, and Stephen A. Wandner. 2023. “Why Are Unemployment Insurance Claims So Low?” Working paper 23-383. W.E. Upjohn Institute. https://doi.org/10.17848/wp23-383.
- Semega, Jessica, and Melissa Kollar. 2022. “Income in the United States: 2021.” Current Population Reports P60-276. US Census Bureau. https://www.census.gov/library/publications/2022/demo/p60-276.html.
Endnotes
- We use “unemployed workers” to indicate “ever been laid off and was either looking for work or receiving UI or both in any given month of the previous year.” See Appendix 1 for a detailed description of the SIPP data and the sample selection. Return to 1
- For initial UI claims, recent research has documented and discussed a decline from its historic rate in the past three decades, a fact that is correlated with structural changes in the occupational composition of employment such as the decline in manufacturing, shorter durations in certain states, and experience rating (Auray and Fuller, 2020; Lachowska et al., 2022; O’Leary et al., 2023). Return to 2
- The base period, as defined by the USDOL, is normally measured as the first four quarters of the last five calendar quarters prior to UI application. Return to 3
- The USDOL collects these in a document of the UI State Rules titled “Monetary Entitlement.” Return to 4
- There is a nonnegligible fraction of workers who receive UI benefits despite failing to meet eligibility criteria. Forsythe and Yang (2021) estimate 3 percent to 4 percent, and Chao (2023) also finds evidence of this fact using the Benefit Accuracy Measurement survey. Return to 5
- The measurement of predicted UI eligibility follows the methodology in Cortes and Forsythe (2023). Return to 6
- By excluding self-employed workers and focusing on those who were laid off, we are also restricting our sample to workers who would not be ineligible for UI because of reasons specific to their job separation. The reference year is always the year before the sampling wave was conducted. Return to 7
- Despite sharing a common timeframe with the federal Pandemic Unemployment Assistance program (PUA) UI expansion, the Census noted that the changes resulting from the program were generally not reflected in the reporting captured by the SIPP 2021 data. See https://www.census.gov/programs-surveys/sipp/tech-documentation/user-notes/2021-usernotes/volat-unemp-comp-during-covid19-pand.html. For recent research studying the effects of the PUA, see, for example, Chao (2023), Greig et al. (2022), and Michaud (2023). Return to 8
- See Appendix 1 for a detailed description of the data and the sample selection and Appendix 2 for summary statistics. Return to 9
- If adjusted for inflation, the median annual personal income adjusted to December 2022 dollars is $43,213. By comparison, in 2022, the Social Security Administration estimates that median net compensation in the United States was $40,847 (https://www.ssa.gov/oact/cola/central.html). Real median personal income in 2022 as calculated from the US Census Bureau was $42,090 in 2023 dollars (https://fred.stlouisfed.org/series/MEPAINUSA672N). The median earnings for all workers (part-time and full-time) were $45,470 (Semega and Kollar, 2022). Return to 10
Suggested Citation
Luduvice, André Victor D., and Anaya Truss-Williams. 2024. “How Insured Are Workers Against Unemployment? Unemployment Insurance and the Distribution of Liquid Wealth.” Federal Reserve Bank of Cleveland, Economic Commentary 2024-16. https://doi.org/10.26509/frbc-ec-202416
This work by Federal Reserve Bank of Cleveland is licensed under Creative Commons Attribution-NonCommercial 4.0 International


- Share