

Residual Seasonality in Five Measures of PCE Inflation
I document residual seasonality in five measures of PCE inflation: headline, core, market-based core, median, and trimmed mean. While these measures are all computed from seasonally adjusted data, I show that each of these measures has had low average monthly inflation in November and December and high average monthly inflation in January from 1987 through the beginning of 2025. The difference in inflation rates from November and December to January is economically and statistically significant. This timing for residual seasonality often gives the impression that monthly inflation is low at the end of the calendar year and jumps to start the year.
The views authors express in Economic Commentary are theirs and not necessarily those of the Federal Reserve Bank of Cleveland or the Board of Governors of the Federal Reserve System. The series editor is Tasia Hane. This paper and its data are subject to revision; please visit clevelandfed.org for updates.
Introduction
Policymakers and economists often calculate inflation as 12-month percent changes in the price index for personal consumption expenditures (PCE). That is, they compute inflation to be the current level of the price index relative to the level of the price index in the same month of the previous year. However, when the inflation rate changes quickly, as it did from 2021 through 2024, using data from a year ago might not give a clear understanding of current economic circumstances. In this case, policymakers and economists might use inflation computations that do not look as far back in time, such as one-month and three-month percent changes.
A potential challenge when using one-month or three-month percent changes is that the price index data may have seasonal patterns, which are fluctuations that are predictable based on the month, often because of weather patterns and holiday or vacation customs.1 These predictable monthly fluctuations are often removed via seasonal adjustment.2 However, seasonal adjustment can be imperfect, and some predictable monthly fluctuations might remain, an occurrence which is known as “residual seasonality.”
In this Economic Commentary, I study five different measures of PCE inflation—headline, core, market-based core, median, and trimmed mean—each computed as a one-month percent change. I document that the one-month inflation rate from each of these measures suffers from residual seasonality. I show residual seasonality in data from February 1987 through January 2025, a span which includes some periods of high inflation, and in data from February 1993 through January 2020, a sample period during which inflation was generally low and relatively stable. I highlight that inflation has been low on average in November and December and high on average in January. For headline PCE inflation, average inflation in January has been 2.0 to 3.2 times higher than in November and December, depending on the sample. For core and market-based core PCE inflation, average inflation in January has been 1.5 to 2.0 times higher than in November and December, depending on the sample. The multiples for median and trimmed-mean inflation range from 1.2 to 1.4.
I focus on PCE-based inflation measures because the Federal Open Market Committee, the monetary-policy-making committee of the Federal Reserve System, views 2 percent PCE inflation over the longer run as being consistent with its statutory mandate. The pattern of residual seasonality I find often gives the impression that monthly inflation rates are low at the end of the calendar year and then jump to start the year, and these fluctuations can make it hard to know if inflation is running at 2 percent. Following the high inflation from 2021 through 2023, residual seasonality can also make it hard to know if the monthly inflation readings are consistent with inflation’s returning sustainably to 2 percent.
Economic research such as Peneva (2014) and Peneva and Sadée (2019) has previously documented residual seasonality in core and market-based PCE inflation. I build on the analysis presented in Peneva and Sadée (2019) by using a longer sample of data and highlighting the predictable monthly fluctuations in November, December, and January.3 Atkinson and Mau (2025) also note that inflation has been high on average in January, but they do not compare January to the preceding November or December.
Data
The five measures of PCE inflation studied here are headline, core, market-based core, median, and trimmed mean. Headline PCE inflation reflects changes in the prices of all goods and services purchased by or on behalf of consumers in the United States.4 The core PCE price index removes food and energy prices from the headline index, and core PCE inflation is computed from this core index. By removing food and energy prices, core inflation is thought to provide a better signal of future inflation than headline inflation, and so core inflation is closely tracked by policymakers.5 The market-based core PCE price index removes food and energy prices plus most imputed expenditures, such as “financial services furnished without payment,” for which deflators are implicit. Market-based core PCE inflation is computed from this market-based core index.6 Bognanni (2020) shows that market-based core inflation has historically been a good predictor of headline inflation.
The Bureau of Economic Analysis (BEA) produces the headline, core, and market-based core PCE indexes.7 I compute headline, core, and market-based core PCE inflation as the one-month percent changes in these indexes. The BEA reports that these data are seasonally adjusted,8 and I take this to mean that these one-month percent changes should not have fluctuations that are predictable based on the month.
Like core and market-based core inflation, median and trimmed-mean inflation are based on excluding price categories. However, the median and trimmed-mean measures do not remove the same categories every month. Median inflation is computed by sorting the price changes of all the price categories from lowest to highest and then keeping the price change in the middle.9 The underlying price change data for computing median inflation are seasonally adjusted. Like median inflation, trimmed-mean inflation arranges price changes of all the price categories from lowest to highest. It then removes some of the categories with the lowest and highest price changes before computing an expenditure weighted average.10 The underlying price change data for computing trimmed-mean inflation are seasonally adjusted.
Monthly Averages
I begin my analysis by computing month-specific averages for each inflation measure. I use a sample of February 1987 through January 2025, giving 38 years of data for each month. The beginning of this sample is limited by data availability for market-based core inflation. The first available month for the market-based core PCE price index is January 1987, making the first one-month inflation calculation available in February 1987. Table 1 shows the month-specific averages.
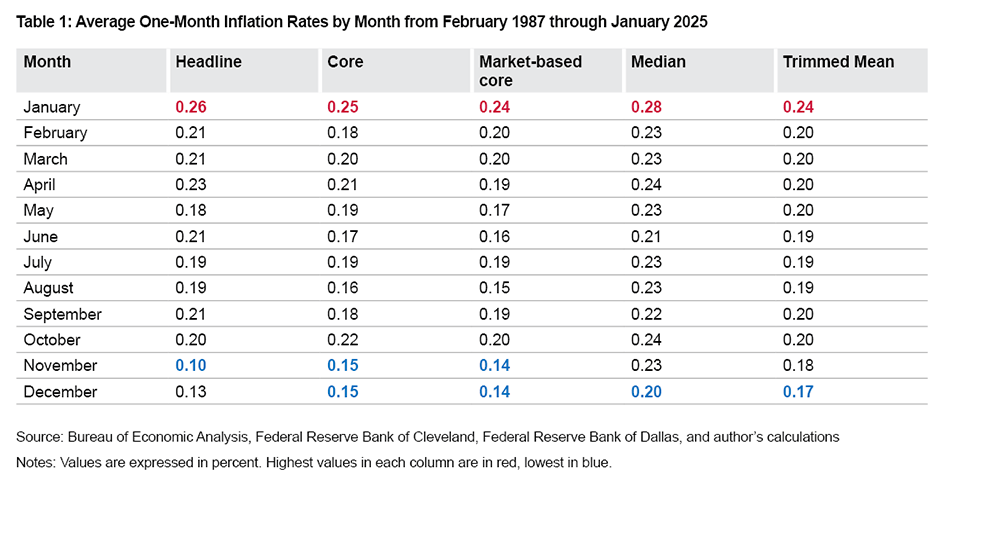
Table 1 shows that, on average, the highest level of monthly inflation across all five measures is in January. On average, the lowest level of monthly inflation is either in November or December, depending on the measure. Despite that each of these measures is computed from seasonally adjusted data, the inflation differences between the highest and lowest months are economically significant. For headline inflation, inflation has been 2.6 times higher in January than in November. For core and market-based core inflation, inflation has been about 1.7 times higher in January than in November or December. The multiples for median and trimmed-mean inflation are lower, with inflation having been 1.4 times higher in January than in December.
Table 2 shows parallel results for February 1993 through January 2020. This is a sample with lower average inflation than during February 1987 through January 2025.11 However, it is still the case in the February 1993 through January 2020 sample that inflation is either highest on average or within 0.1 percentage points of the highest in January and lowest on average in November and December.
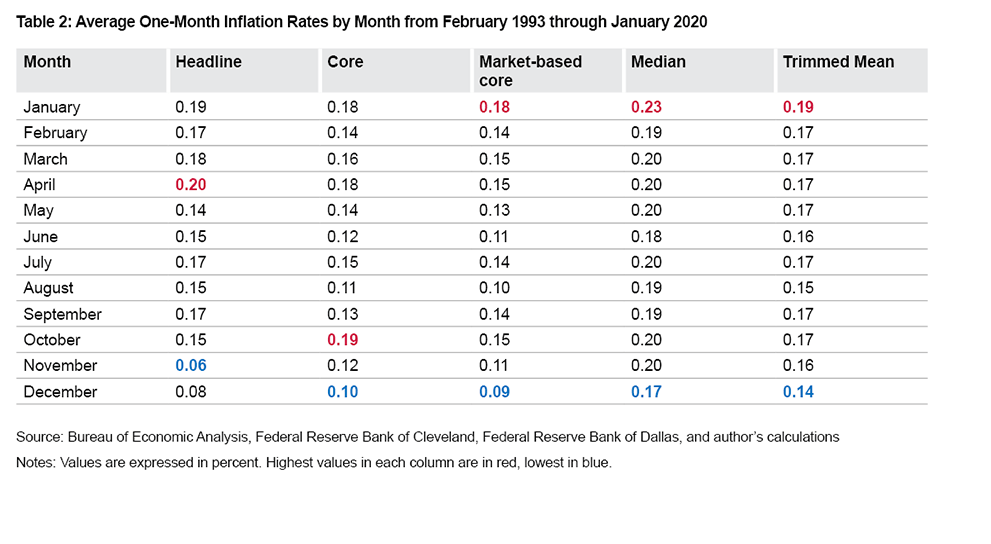
The differences between average inflation in January compared to November and December remain economically significant in the February 1993 through January 2020 sample. For headline inflation, inflation has been 3.2 times higher in January than in November. For core and market-based core inflation, inflation has been 1.8 and 2.0 times higher, respectively, in January than in December. For median and trimmed-mean inflation, inflation has been about 1.4 times higher in January than in December.
Comparing Inflation in January to Inflation in November and December
The previous section shows that reported inflation has been highest on average in January and lowest in November and December and that the difference in average inflation rates across these months could be quite large depending on the inflation measure. Different averages reported in the previous section are not just flukes generated by randomness in the data; rather, reported inflation appears to have been systematically different in January than in November and December, meaning that it has had a seasonal pattern despite already being seasonally adjusted.
For the analysis in this section, I study inflation rates that are either two months apart (November to January) or one month apart (December to January). Using months that are close together in time allows me to compare inflation rates in similar economic circumstances. Hence, if the data have no seasonal pattern, then there is no reason to believe that inflation in a given January should be systematically higher or lower than inflation in the preceding November or December.12
The top panels of Figure 1 show comparisons of headline inflation in January to headline inflation in either November or December, depending on the sample period, of the previous year. The bottom panels show comparisons of core inflation in January to core inflation in either November or December of the previous year, again, depending on the sample period.
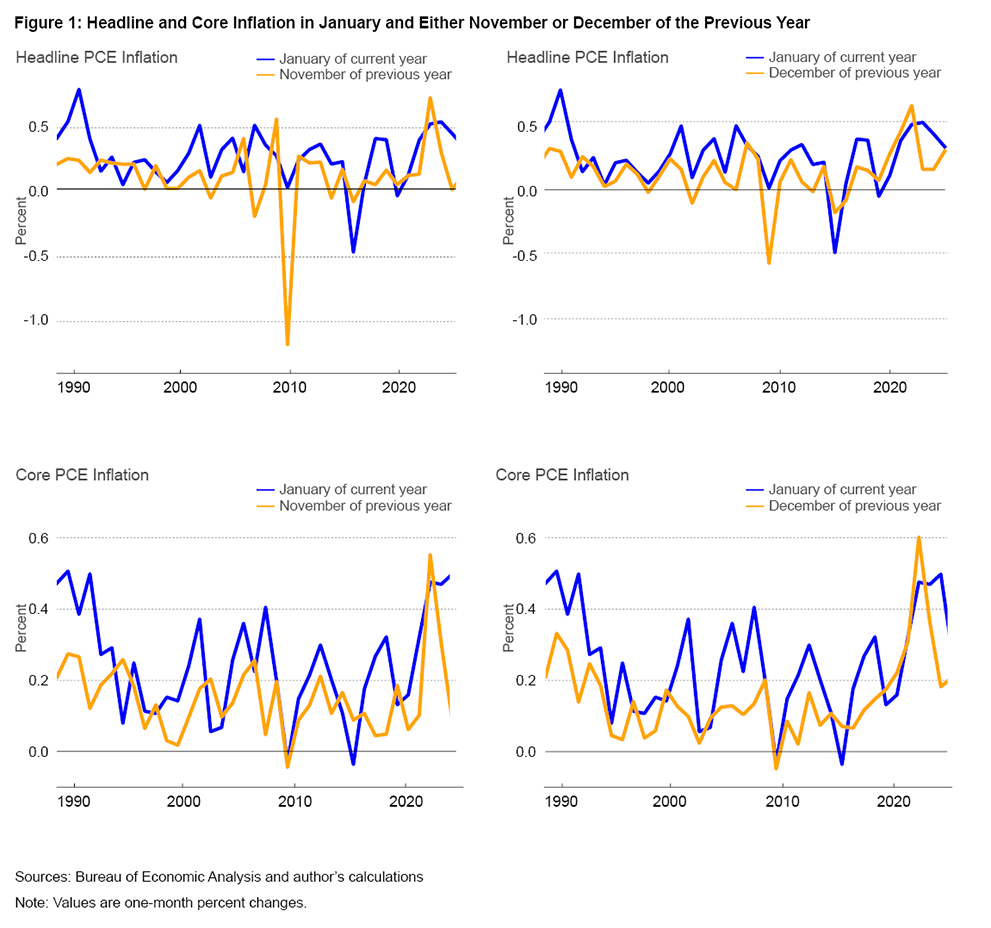
Figure 1 shows that inflation in January is often higher than inflation in the preceding November or December. Putting numbers to how often January has higher inflation than the preceding November, in each of these five categories of inflation measure, I observe the following:
- Headline: January is higher in 28 out of 38 years (74 percent)
- Core: January is higher in 29 out of 38 years (76 percent)
- Market-based core: January is higher in 31 out of 38 years (82 percent)
- Median: January is higher in 28 out of 38 years (74 percent)
- Trimmed mean: January is higher in 27 out of 38 years (71 percent)
For the comparison of January to the preceding December, I observe the following:
- Headline: January is higher in 31 out of 38 years (82 percent)
- Core: January is higher in 30 out of 38 years (79 percent)
- Market-based core: January is higher in 29 out of 38 years (76 percent)
- Median: January is higher in 35 out of 38 years (92 percent)
- Trimmed mean: January is higher in 32 out of 38 years (84 percent)
Despite the similar economic circumstances, inflation in January is very often higher than inflation in the preceding November and December.
Next, I compute formal statistical tests. Based on the assumption that inflation in a given January should not be systematically higher or lower than inflation in the preceding November or December, my null hypothesis is that the change in inflation from November to January or December to January is expected to be zero. I show the average change in inflation from November to January in Table 3 and the average change in inflation from December to January in Table 4. I also show the corresponding standard errors and t-statistics. The standard error gives a sense of how much uncertainty there is about the average change. The t-statistic is a common test of statistical significance; a t-statistic larger than 1.96 is commonly used to reject a null hypothesis.
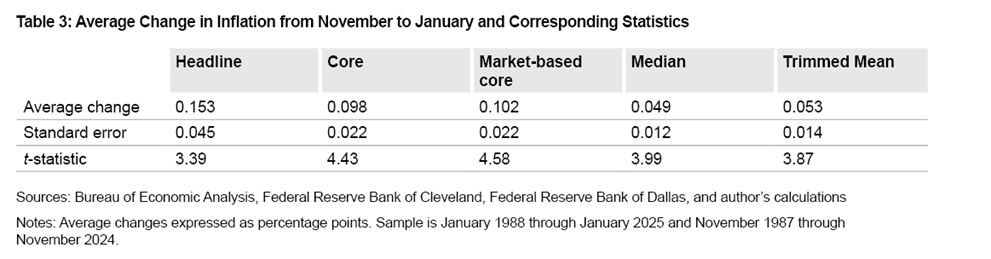

Tables 3 and 4 show that the average changes in inflation from November to January and December to January are positive for all measures, consistent with the data in Table 1. Further, Tables 3 and 4 show that these increases all have low standard errors and t-statistics well above 1.96. Hence, I reject the null hypothesis that the changes in inflation from November and December to January are zero. That is, the positive average changes are not flukes, and reported inflation appears to be systematically different in January than in November and December.13
Conclusions
The difference in PCE inflation rates from November and December to January is economically large and statistically significant. For headline PCE inflation, average inflation in January has been 2.0 to 3.2 times higher than in November and December, depending on the sample period. For core and market-based core PCE inflation, average inflation in January has been 1.5 to 2.0 times higher than in November and December, again, depending on the sample period. These multiples for median and trimmed mean inflation range from 1.2 to 1.4. The timing for this residual seasonality often gives the impression that monthly inflation is low at the end of the calendar year and jumps at the start of the year. Following the high inflation from 2021 through 2023, these residual seasonal fluctuations can complicate assessments of monthly data, making it hard to know if inflation is returning sustainably to 2 percent.
References
- Atkinson, Tyler, and Ron Mau. 2025. “Is Inflation Still Slowing? Early 2025 Data Pivotal to Outlook.” Dallas Fed Economics. February 11, 2025. https://www.dallasfed.org/research/economics/2025/0211.
- Board of Governors of the Federal Reserve System. 2024. “Transcript of Chair Powell’s Press Conference, December 18, 2024.” https://www.federalreserve.gov/mediacenter/files/FOMCpresconf20241218.pdf.
- Bognanni, Mark. 2020. “A Forecasting Assessment of Market-Based PCE Inflation.” Economic Commentary, No. 2020-01 (January). https://doi.org/10.26509/frbc-ec-202001.
- Consolvo, Victoria, and Kurt G. Lunsford. 2019. “Residual Seasonality in GDP Growth Remains after Latest BEA Improvements.” Economic Commentary, No. 2019-05 (April). https://doi.org/10.26509/frbc-ec-201905.
- Doppelt, Ross. 2023. “Should Macroeconomists Use Seasonally Adjusted Time Series? Structural Identification and Bayesian Estimation in Seasonal Vector Autoregressions.” Working paper. https://economics.indiana.edu/documents/should-macroeconomists.pdf.
- Dzikowski, Daniel, and Carsten Jentsch. 2024. “Structural Periodic Vector Autoregressions.” Working paper. https://doi.org/10.48550/arXiv.2401.14545.
- Lunsford, Kurt G. 2017. “Lingering Residual Seasonality in GDP Growth.” Economic Commentary, No. 2017-06 (March). https://doi.org/10.26509/frbc-ec-201706.
- McCulla, Stephanie H., and Shelly Smith. 2015. “Preview of the 2015 Annual Revision of the National Income and Product Accounts.” Survey of Current Business 95(6). https://apps.bea.gov/scb/pdf/2015/06%20June/0615_preview_of_2015_annual_revision_of_national_income_and_product_accounts.pdf.
- Peneva, Ekaterina. 2014. “Residual Seasonality in Core Consumer Price Inflation.” FEDS Notes. Board of Governors of the Federal Reserve System. https://doi.org/10.17016/2380-7172.0030.
- Peneva, Ekaterina, and Nadia Sadée. 2019. “Residual Seasonality in Core Consumer Price Inflation: An Update.” FEDS Notes. Board of Governors of the Federal Reserve System. https://doi.org/10.17016/2380-7172.2318.
- US Bureau of Economic Analysis. “National Income and Product Accounts.” Accessed February 28, 2025. https://apps.bea.gov/iTable/?reqid=19&step=2&isuri=1&categories=survey&_gl=1*l7pzyw*_ga*MTE0MDIwOTc5My4xNzA5MjE3MjA3*_ga_J4698JNNFT*MTc0MTEwNDg3Ny4yOS4xLjE3NDExMDQ5NjEuNjAuMC4w.
Endnotes
- Twelve-month percent changes are not subject to these seasonal patterns because they compare the current month’s price index to the index from the same month in the preceding year. Return to 1
- While policymakers and economists very often use seasonally adjusted data in their analyses and research, methods for analyzing data that are not seasonally adjusted do exist. For example, see Doppelt (2023) and Dzikowski and Jentsch (2024). Return to 2
- Residual seasonality has also been documented in other economic variables, such as GDP growth. For further information, see the research done by Lunsford (2017) and Consolvo and Lunsford (2019). Return to 3
- See bea.gov/data/personal-consumption-expenditures-price-index. Return to 4
- For example, in the press conference following the December 17–18, 2024, Federal Open Market Committee meeting, Chair Powell said, “[T]he goal overall is headline inflation, because that’s what people experience. . . . But, as we know, headline inflation contains energy and food, and those prices can fluctuate for reasons that are not related to tightness in the economy and therefore are not really good predictors of future inflation. . . . So we look at core inflation because it’s a better measure of what future inflation is. . . likely to be.” See page 24 of Board of Governors of the Federal Reserve System (2024) at federalreserve.gov/mediacenter/files/FOMCpresconf20241218.pdf. Return to 5
- See bea.gov/help/faq/83. Return to 6
- These indexes are available at a monthly frequency and can be found in lines 1, 25, and 31, respectively, of the National Income and Product Account Table 2.8.4, downloaded from apps.bea.gov/iTable/?reqid=19&step=2&isuri=1&categories=survey&_gl=1*l7pzyw*_ga*MTE0MDIwOTc5My4xNzA5MjE3MjA3*_ga_J4698JNNFT*MTc0MTEwNDg3Ny4yOS4xLjE3NDExMDQ5NjEuNjAuMC4w. See Bureau of Economic Analysis (2025). Return to 7
- In practice, the BEA often uses seasonally adjusted source data when constructing its measures of consumption, consumption prices, and other national economic accounts. See page 4 of McCulla and Smith (2015). This means that other government agencies, such as the Bureau of Labor Statistics or the Census Bureau, seasonally adjust the data the BEA uses to construct price indexes. Return to 8
- Formally, this sorting is weighted by consumption expenditures, and median inflation is the component whose expenditure weight is in the 50th percentile of price changes. I get median PCE inflation from the Federal Reserve Bank of Cleveland, available at clevelandfed.org/indicators-and-data/median-pce-inflation. Return to 9
- I get trimmed-mean PCE inflation from the Federal Reserve Bank of Dallas, available at dallasfed.org/research/pce. The Dallas Reserve Bank reports one-month trimmed-mean inflation at an annualized rate. I undo this annualization before conducting my analysis and reporting results Return to 10
- For headline inflation, the average one-month percent change was 0.15 percent (1.8 percent annualized) from February 1993 through January 2020. The corresponding averages for February 1987 through January 1993 and February 2020 through January 2025 were each 0.30 percent (3.7 percent annualized). Return to 11
- To be clear, this argument depends on seasonal adjustment’s working correctly. Otherwise, the presence of Christmas in December could indeed make the economic circumstances different in December and January. Return to 12
- Using a sample of November 1993 through January 2020 produces results that are similar to those in Tables 3 and 4: All average changes are positive, and all t-statistics are larger than 1.96. Inflation in January appears systematically different than inflation in November and December even during a period of low and relatively stable inflation. Return to 13
Suggested Citation
Lunsford, Kurt G. 2025. “Residual Seasonality in Five Measures of PCE Inflation.” Federal Reserve Bank of Cleveland, Economic Commentary 2025-03. https://doi.org/10.26509/frbc-ec-202503
This work by Federal Reserve Bank of Cleveland is licensed under Creative Commons Attribution-NonCommercial 4.0 International


- Share
About Us
The Federal Reserve Bank of Cleveland (commonly known as the Cleveland Fed) is part of the Federal Reserve System, the central bank of the United States.