

Demand for College Labor in the 21st Century
Tracing the evolution of labor demand in the United States, this Economic Commentary reveals that the disproportionate rise in relative productivity of college-educated labor that shaped the latter half of the 20th century has plateaued since 2000. Our analysis suggests that technical change in the 21st century may no longer favor college graduates, in which case further growth in the employment share of college-educated workers would likely lower the premium that college-educated workers receive compared with non-college-educated workers.
The views authors express in Economic Commentary are theirs and not necessarily those of the Federal Reserve Bank of Cleveland or the Board of Governors of the Federal Reserve System. The series editor is Tasia Hane. This paper and its data are subject to revision; please visit clevelandfed.org for updates.
Educational attainment has risen dramatically over the past century. With each generation investing more in postsecondary education than the previous generation, the share of workers holding at least a bachelor’s degree increased from less than 15 percent in the 1960s to over 40 percent in 2022. Basic economic theory suggests that when the supply of something increases, its price typically falls. Applying this principle to the job market, we might expect the substantial increase in the number of college-educated workers to have narrowed the wage gap between college-educated and non-college-educated labor. In reality, however, the salaries of college graduates have soared relative to the salaries of non-college-graduates, thus widening the wage gap and becoming a defining economic trend of the late 20th century. By the year 2000, a typical college graduate earned significantly more than their 1960s counterpart, while non-college-graduate salaries increased at a much slower rate.
The rising wage premium for college-educated workers, despite their increasing numbers, indicates that employer demand for such workers has grown even faster than their supply. This demand growth reflects improvements in the relative efficiency of college-educated labor in production, often attributed to advancements in technology. The IT revolution and subsequent advances in automation are believed to have enhanced productivity by automating routine and manual tasks, typically performed by non-college-educated workers, while complementing complex and cognitive tasks, typically performed by college-educated workers (Autor et al., 2003).1
The extent of this “college bias” in labor demand depends critically on how easily interchangeable college-educated and non-college-educated workers are. If they are poor substitutes, as widely believed, then the growing supply of college-educated workers must be accompanied by a tremendous growth in their relative efficiency. However, recent research by Bils et al. (2024) on worldwide trends in educational attainment and wage premia for schooling show that such an improvement in labor efficiency would imply unrealistically high output growth. They conclude that the relative stability of (wage) returns to education worldwide despite rising educational attainment underscores instead that educational wage gaps are not very responsive to shifts in relative supplies of education groups, and, therefore, they advocate for a higher degree of substitutability in long-term analyses.2
In this Economic Commentary, we document the trends in the college wage premium and relative supply of college labor in the United States since the 1960s and ask what these trends imply for the relative efficiency of college-educated labor in production. Deviating from the earlier literature, we allow for easier substitution between workers with different educational backgrounds. Our estimates show that the relative efficiency of college-educated labor grew far less dramatically than previously thought. Furthermore, we find the relative efficiency of college labor has plateaued since the turn of the century, suggesting that technological progress since 2000 has been neutral toward different education groups. Assuming sustained growth in the employment share of college-educated labor and a continued lack of skill bias in technological progress, we project a decline in the college wage premium over the coming decades. We conclude by assessing the relative roles of technological factors and labor quality in this shift toward education-neutral growth in labor efficiency.
Data3
Our primary data sources include the Current Population Survey’s Annual Social and Economic Supplement (CPS) for wages and labor supply data, obtained from IPUMS (Flood et al., 2023), and the Bureau of Economic Analysis’s National Income and Product Accounts for real GDP data. Our labor input sample includes all employed and unemployed respondents aged 16–70. The wage sample is limited to full-time, full-year workers, excluding those with imputed earnings.4 Our sample period spans the years from 1963, when the wage data become available, through 2022. The college wage premium and relative supply of college labor are constructed by grouping workers into two categories: those with at least a bachelor’s degree and those without. We calculate the college wage premium as the ratio of average weekly wages between these groups.
Following the literature, we measure relative supply by the ratio of total hours worked between the two education groups. To account for differences in human capital within each education group, we further divide workers based on years of experience and other aspects of demographics. For example, a college-educated worker with 20 years of work experience is likely much more productive than an otherwise comparable new graduate, with the difference in productivity likely reflected in higher pay for the experienced worker. Accordingly, to reflect differences in human capital and associated labor input, we weight hours of employment according to the average wage in their subgroup to compute the effective labor input. For instance, if the experienced college-educated worker earns twice as much as the new graduate, we consider that experienced worker to effectively provide twice the quantity of labor.5
Evolution of the College Wage Premium and Relative Supply
Figure 1 shows the resulting empirical trends from our analysis. The relative supply of college labor is depicted by the black line on the left axis. It rises from 20 percent of non-college-educated labor in the late 1960s to about 100 percent in recent years, implying that about half of the total labor input is now provided by college-educated labor. As the supply of college-educated workers grew, so did their pay. The college wage premium, shown by the red line on the right axis, rose substantially. In the late 1960s, a typical college-educated worker earned about 60 percent more than a comparable non-college-educated worker. This wage premium grew dramatically throughout the 1980s and 1990s and peaked at more than 100 percent around 2000. Since then, it has retreated to 90 percent.
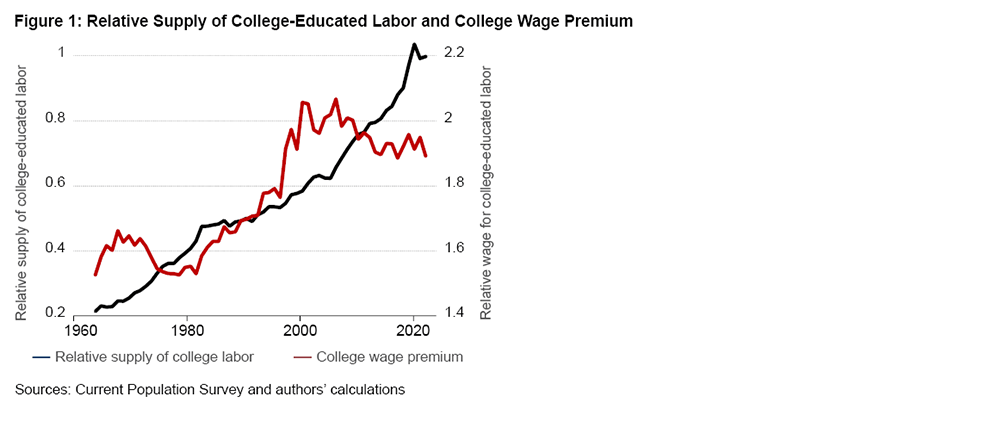
One might view the recent decline in the college wage premium as evidence for a decline in the relative efficiency of college-educated labor, but doing so would not recognize that the relative supply of college-educated labor grew particularly fast during the same period. It is plausible that the college wage premium would have fallen by more in response to this rise in supply but did not because of an ever-growing demand for college-educated labor. To gauge how much labor demand really favored college graduates, one must first ascertain how much the wage premium would have fallen in the absence of any bias toward the college educated in demand, and this, in turn, depends on the extent of labor substitutability between the two groups of workers.
Labor Substitutability and Relative Efficiency of College Labor
The substitutability of college-educated and non-college-educated workers plays a key role in understanding the growth of the college wage premium and the underlying growth in the relative efficiency of college labor. Figure 2 illustrates this concept using two scenarios: low and high elasticity of labor substitution.
In both panels, the vertical axis shows the wage rate for college-educated labor relative to non-college-educated labor, while the horizontal axis shows the relative employment. The downward-sloping red line represents the relative demand for college-educated labor. A steep relative demand line reflects a situation in which changes in the wage ratio have little impact on the employment ratio, suggesting that the elasticity of substitution between college-educated and non-college-educated workers is low. Contrastingly, a flat relative demand line implies that changes in the wage ratio have a large impact on the relative employment ratio, meaning that employers can substitute between college-educated and non-college-educated workers relatively easily. Thus, Figure 2, panel (a) shows an economy in which it is relatively difficult to substitute college labor, while Figure 2, panel (b) shows an economy in which the elasticity of substitution is high.
Point A in both charts represents the 1960s labor market equilibrium, showing the college wage premium and relative college employment at that time. Point B shows the corresponding equilibrium for the present, with relatively higher wages and levels of employment for college-educated workers.
When the relative supply of college graduates increases from (C/NC)1963 to (C/NC)2022, we would expect the wage premium for college-educated labor to decrease, all else remaining equal, as shown by point B'. This drop is larger in Figure 2, panel (a), in which substitution is more difficult. However, since the wage premium actually increased, we can infer that the demand curve must have shifted upward. The difference between the actual 2022 wage premium and the hypothetical one, that is, the vertical distance between points B and B', indicates the extent of relative demand growth.
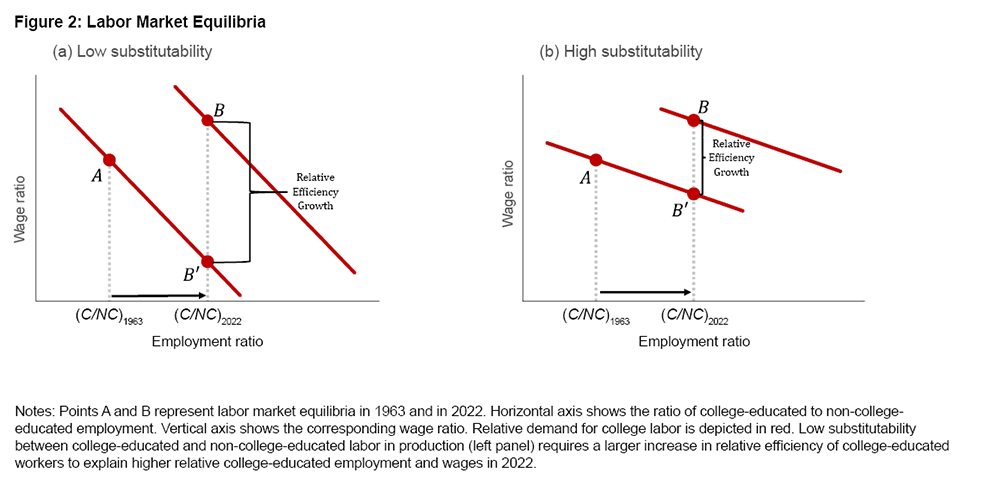
Because a steeper demand schedule foresees a larger decline in the wage premium in response to a growing relative quantity of college labor, a larger shift in labor demand is needed to explain the observed college wage premium.
Generally, a shift in labor demand occurs when workers become more efficient at their jobs so that a given quantity of labor produces more output. The shifts in relative demand in Figure 2, therefore, represent an improvement in the efficiency of college-educated labor relative to non-college-educated labor. By calculating the hypothetical fall in the wage premium for a given substitution elasticity and comparing it to the observed wage premium, we can estimate the relative efficiency growth of college-educated labor.6
Efficiency Growth in College-Educated Labor
Following recent estimates from Bils et al. (2024), we compute the relative efficiency growth of college-educated and non-college-educated labor with a relatively high elasticity of substitution of 5.7 To illustrate what this number means, consider a scenario in which the college-educated population increases from one-third to two-thirds of the workforce. This is a four-fold increase in relative college-educated supply (from 0.5 = 0.33/0.66 to 2 = 0.66/0.33). With a substitution elasticity of 5, we would expect the college wage premium to fall by 24 percent.8 By comparison, the college wage premium would fall by 60 percent with a substitution elasticity of 1.5, as commonly assumed in the literature.9
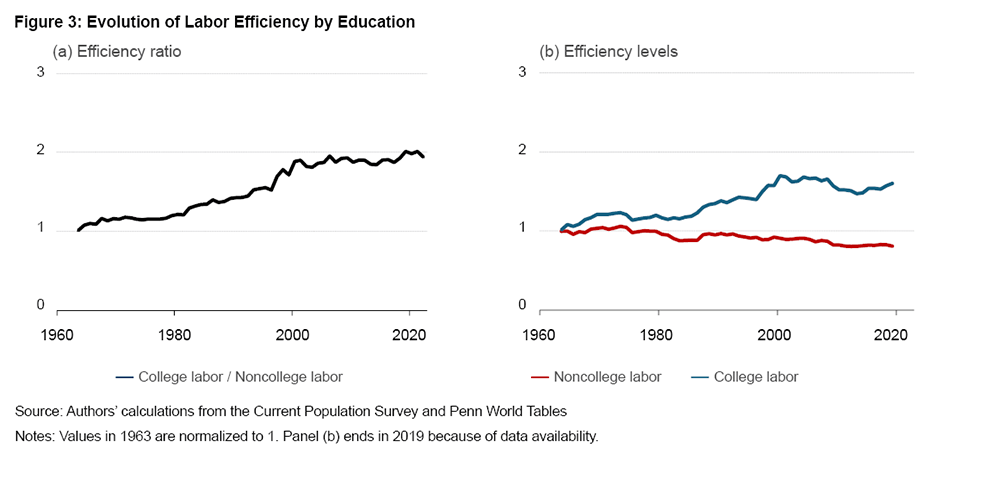
Because higher substitution elasticities call for a smaller wage response to an expansion in supply, the level of relative efficiency growth needed to overcome the downward wage pressure from rising college attainment is not as great as claimed in the literature (see, for instance, Caselli and Coleman, 2002). The solid line in Figure 3, panel (a) displays our estimate for the efficiency of a college-educated worker relative to a non-college-educated worker implied by the trends in Figure 1 and a substitution elasticity of 5. With the value in 1963 normalized to 1, we estimate that college-educated labor is twice as efficient as it was in 1963 relative to non-college-educated labor.
Of course, relative efficiency grows either when college-educated labor becomes more efficient or when non-college-educated labor becomes less efficient. There are reasons to think why the latter might have played a role. Import competition has disproportionately affected sectors that primarily employ non-college-educated labor, such as manufacturing. At the same time, new production technologies automated away the need for tasks that are typically performed by non-college-educated labor. Both of these developments tended to lower the demand for non-college-educated labor and put downward pressure on its wages and productivity. Another possibility is that the pool of non-college-educated labor may comprise less-productive workers over time if the most productive would-be non-college-educated graduates in the 1960s now get a college degree.
To assess these scenarios, we compute the efficiency levels of college-educated and non-college-educated labor separately. The red line in Figure 3, panel (b) shows the efficiency level of non-college-educated labor consistent with labor’s contribution to output growth in the United States during our sample period and the payroll share of college-educated labor given a substitution elasticity of 5.10 Multiplying the series shown in red with the relative college efficiency gives the level of college efficiency shown in blue. Values for both series are normalized to equal 1 in 1963. The resulting estimates show that efficiency of non-college-educated labor indeed fell, but only by about a third since 1963. This indicates that the two-fold increase in relative college-educated-labor efficiency in Figure 3, panel (a) was driven largely by improved efficiency of college-educated labor rather than a decline in non-college-educated labor.
These estimates are remarkably different than those suggested by a low-substitutability scenario in the literature. Consider, for instance, a substitution elasticity of 1.5, which would imply that the relative efficiency of college-educated workers must have increased by 48-fold over the sample period. This implies that if two non-college-educated workers were needed on the margin to do a college graduate’s job in the 1960s, 96 non-college-educated workers would be needed today. With such a dramatic increase in efficiency, output should have skyrocketed to roughly six times its actual value. The only way to reconcile the dramatic growth in relative efficiency with the historical 2 percent to 3 percent annual output growth during this period is to accept a titanic decline in the efficiency level of non-college-educated labor—about 85 percent—meaning that roughly 6 (=1/ (1-0.85)) non-college-educated workers today would be needed to do the job of one in the 1960s. These implications are difficult to accept as plausible.
Another important observation in Figure 3 is that the relative efficiency of college-educated labor plateaued starting around 2000, suggesting that technological advances in the new millennium may not have favored college-educated labor as much as previously thought. This shift toward education-neutral growth in labor demand has important implications for our understanding of labor markets, wage inequality, and education policies. The push for higher education and STEM skills, for instance, might be less justified if technological change did not specifically favor these skills.
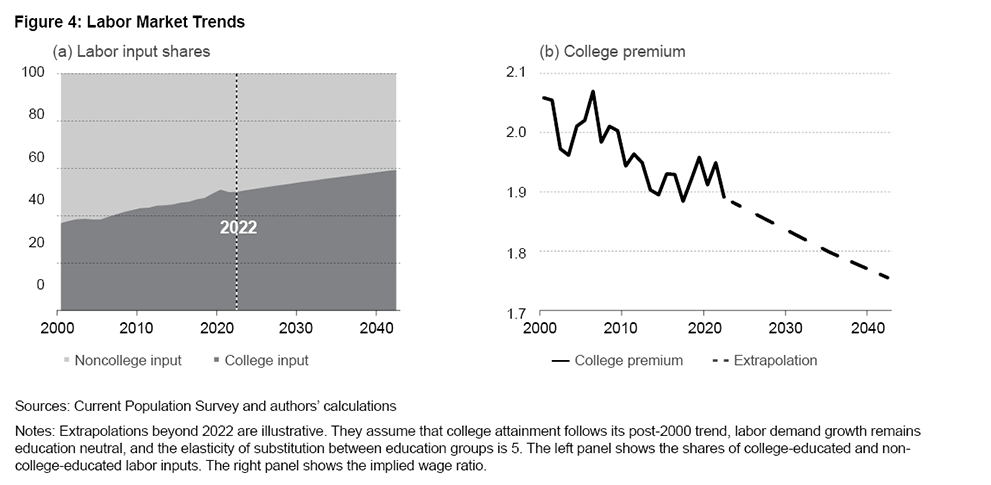
If future demand growth remains neutral, then higher college attainment may reflect negatively on the college wage premium, as it recently has (Figure 1). For illustrative purposes, Figure 4 shows extrapolations of the relative supply of college-educated labor and the college wage premium into the future assuming inputs by college-educated and non-college-educated labor continue their post-2000 trends and assuming labor demand continues to grow in an education-neutral fashion. In this scenario, college-educated labor represents 60 percent of effective labor by 2042, up 10 percentage points from its current level. With our preferred elasticity of labor substitution, this translates into a 13 percentage point reduction college wage premium from its current level of 89 percent to 76 percent. This is reasonable given the 10 percentage point growth in college-educated labor’s share. A low elasticity of substitution would instead imply a 36 percentage point drop in the college wage premium, lowering it to its 1980s level of 64 percent.
Overall, the high-substitutability scenario presents a more plausible explanation for the observed trends in the college wage premium and labor supply while avoiding the extreme implications of the low-substitutability model. We next discuss what might explain the shift toward neutral demand growth.
Technology Trends and Labor Quality: Comments and Caveats
The prevailing view in economics attributes the rising wage premium for college education to skill-biased technical change (SBTC), the idea that technology complements the skills of college-educated workers and substitutes for the skills of non-college-educated workers. Our findings align with this view for the 1980s and 1990s in a qualitative sense, but they suggest smaller efficiency gains than previously thought. However, our results challenge the continuation of that trend into the twenty-first century. Before hypothesizing why technology might have shifted toward a skill-neutral direction, we should note that our findings do not necessarily rule out SBTC. Because efficiency reflects both technological factors and labor quality, it is possible these two components trended in opposite directions, offsetting each other. For instance, technology might have continued to favor college-educated labor while average quality of skills pertaining to college-educated labor may have declined relative to non-college-educated labor. Without direct measurement of either factor, it is difficult to eliminate this possibility.
One approach to measuring the skill bias of technology has been to examine capital that presumably requires more advanced skills, such as computers or advanced machinery. The literature has emphasized advances in computers (Autor et al., 2003) or, more broadly, growth in equipment capital as direct measures of skill-biased technical change.11 Recent data show that investment in equipment capital grew at the same pace before and after 2000—about four fold—suggesting that technology might have continued to favor college-educated workers (Ohanian et al., 2023; Maliar et al., 2022). If the complementarity between college-educated labor and equipment remained stable, this should have raised the college wage premium, barring a substantial decline in relative college quality.
While a systematic decline in college quality seems unlikely in absolute terms, the nature of the relationship between educational attainment and job skills may have changed. High schools have incorporated more technology-intensive skills into their curricula, and states are investing more in education technology as equipment costs decline. As high-tech equipment has become more prevalent in classrooms, younger generations have become familiar with technology earlier, narrowing the skills gap between education groups (Escueta et al., 2020). This narrowing suggests that technical change remains skill biased, but these skills correlate less with college education now than they did in the twentieth century.
An alternative explanation is that technology is no longer skill biased. Recent advances have simplified operation of machinery and equipment, making these jobs more accessible for those without advanced degrees. This deskilling of the production process has historical precedent, such as the development of the assembly line in the early twentieth century. Along these lines, Beaudry et al. (2016) argue that the growing demand for cognitive tasks in the late twentieth century reversed after 2000, resulting in many college graduates’ taking jobs that were historically performed by non-college-educated workers. This is partly consistent with our findings and suggests the skills of college-educated labor may be underutilized in today’s economy.
The evolving nature of college education and its alignment with labor demand remains a vibrant area of research. A more granular analysis of the evolution of skill requirements across industries or occupations could further underpin the skill-neutrality of recent technological advances. Cross-country analyses could reveal whether these patterns are unique to the United States or represent a global phenomenon. These investigations would not only offer valuable insights into the relationship between education and productivity, but they would also inform policy decisions on education and workforce development.
References
- Autor, David H., Lawrence F. Katz, and Alan B. Krueger. 1998. “Computing Inequality: Have Computers Changed the Labor Market?” Quarterly Journal of Economics 113 (4): 1169–1213. doi.org/10.1162/003355398555874.
- Autor, David H., Frank Levy, and Richard J. Murnane. 2003. “The Skill Content of Recent Technological Change: An Empirical Exploration.” Quarterly Journal of Economics 118 (4): 1279–1333. doi.org/10.1162/003355303322552801.
- Beaudry, Paul, David A. Green, and Benjamin M. Sand. 2016. “The Great Reversal in the Demand for Skill and Cognitive Tasks.” Journal of Labor Economics 34 (S1): S199–247. doi.org/10.1086/682347.
- Bils, Mark, Bariş Kaymak, and Kai-Jie Wu. 2024. “Labor Substitutability among Schooling Groups.” American Economic Journal: Macroeconomics 16 (4): 1–34. doi.org/10.1257/mac.20220288.
- Bowlus, Audra, Lance Lochner, Chris Robinson, and Eda Süleymanoğlu. 2023. “Wages, Skills, and Skill-Biased Technical Change: The Canonical Model Revisited.” Journal of Human Resources 58 (6): 1783–1819. doi.org/10.3368/jhr.0617-8889R1.
- Caselli, Francesco, and Wilbur John Coleman, II. 2002. “The US Technology Frontier.” American Economic Review 92 (2): 148–152. doi.org/10.1257/000282802320189159.
- Escueta, Maya, Andre Joshua Nickow, Philip Oreopoulos, and Vincent Quan. 2020. “Upgrading Education with Technology: Insights from Experimental Research.” Journal of Economic Literature 58 (4): 897–996. doi.org/10.1257/jel.20191507.
- Feenstra, Robert C., Robert Inklaar, and Marcel P. Timmer. 2015. “The next Generation of the Penn World Table.” American Economic Review 105 (10): 3150–3182. doi.org/10.1257/aer.20130954.
- Flood, Sarah, Miriam King, Renae Rodgers, Steven Ruggles, J. Robert Warren, Daniel Backman, Annie Chen, Grace Cooper, Stephanie Richards, Megan Schouweiler, and Michael Westberry. 2023. “IPUMS, Current Population Survey: Version 11.0 [Dataset].” Minneapolis, MN: IPUMS. doi.org/10.18128/D030.V11.0.
- Hendricks, Lutz, and Todd Schoellman. 2018. “Human Capital and Development Accounting: New Evidence from Wage Gains at Migration.” Quarterly Journal of Economics 133 (2): 665–700. doi.org/10.1093/qje/qjx047.
- Jones, Benjamin F. 2014. “The Human Capital Stock: A Generalized Approach.” American Economic Review 104 (11): 3752–3777. doi.org/10.1257/aer.104.11.3752.
- Karabarbounis, Loukas, and Brent Neiman. 2014. “The Global Decline of the Labor Share.” Quarterly Journal of Economics 129 (1): 61–103. doi.org/10.1093/qje/qjt032.
- Katz, Lawrence F., and David H. Autor. 1999. “Changes in the Wage Structure and Earnings Inequality.” In Handbook of Labor Economics, edited by Orley C. Ashenfelter and David Card, 3A: 1463–1555. Elsevier. doi.org/10.1016/S1573-4463(99)03007-2.
- Katz, Lawrence F., and Kevin M. Murphy. 1992. “Changes in Relative Wages, 1963–1987: Supply and Demand Factors.” Quarterly Journal of Economics 107 (1): 35–78. doi.org/10.2307/2118323.
- Krusell, Per, Lee E. Ohanian, José-Víctor Ríos-Rull, and Giovanni L. Violante. 2000. “Capital-Skill Complementarity and Inequality: A Macroeconomic Analysis.” Econometrica 68 (5): 1029–1053. doi.org/10.1111/1468-0262.00150.
- Maliar, Lilia, Serguei Maliar, and Inna Tsener. 2022. “Capital-Skill Complementarity and Inequality: Twenty Years After.” Economics Letters 220 (November):110844. doi.org/10.1016/j.econlet.2022.110844.
- Ohanian, Lee E., Musa Orak, and Shihan Shen. 2023. “Revisiting Capital-Skill Complementarity, Inequality, and Labor Share.” Review of Economic Dynamics 51 (December): 479–505. doi.org/10.1016/j.red.2023.05.002.
- US Bureau of Economic Analysis. 2024. “Personal Income and Outlays, May 2024.” News Release BEA 24-28. bea.gov/news/2024/personal-income-and-outlays-may-2024.
Endnotes
- While the literature emphasized skill bias in technical change as the leading source of relative demand growth, other factors, such as a secular improvement in the quality of college education or changes in task assignments, can also improve the relative efficiency of college-educated labor and, thereby, raise its relative demand. Return to 1
- Similarly, Hendricks and Schoellman (2018) argue that observed wage gains from migration to the United States suggest a high degree of substitutability between education groups. Bowlus et al. (2023) argue that better accounting for cyclical movements in labor demand suggests a higher elasticity of substitution. Return to 2
- We closely follow the literature in our treatment of the data to preserve comparability with existing work. Thus, any difference in findings can be attributed solely to our choice of a higher degree of substitutability between education groups. Return to 3
- We define full-time employment to be at least 35 hours of work per week and full-year employment as at least 40 weeks of work during the year. We restrict the wage sample to earnings above the 1976 minimum wage in real terms and above the bottom percentile of earnings in each year. Top coded earnings are adjusted up by 50 percent following Autor and Katz (1999). Return to 4
- This commonly adopted approach treats all workers with the same level of education as perfect (but unequal) substitutes for each other. This is a strong assumption and could affect the results if workers of different experience, for instance, are imperfect substitutes for each other. Return to 5
- Specifically, we assume that effective labor input is a constant-elasticity-of-substitution aggregator of college-educated and non-college-educated labor. Denoting the growth rate by G, efficiency growth can then be calculated as G(Efficiency Ratio) = G(College Wage Premium)(s/(s-1)) x G(Relative College Supply) 1/s, where s denotes the elasticity of labor substitution and takes on values greater than 1. Return to 6
- Bils et al. (2024) estimate a lower bound of 4.3 for the elasticity of substitution. Return to 7
- The traditional estimates of the elasticity of substitution vary between 1.4 in Katz and Murphy (1992) to 1.7 in Krusell et al. (2000). Our low-substitutability scenario lies in the middle, at 1.5. Return to 8
- See Jones (2014) and Bils et al. (2024) on how to back out efficiency growth from data on payroll growth and the trends in the payroll shares of education groups given an elasticity of labor substitution. Our calculations combine data on output and capital stock from Penn World Tables for the years 1963 to 2019 (Feenstra et al., 2015), labor share of income data from Karabarbounis and Neiman (2014), and payroll shares of college-educated and non-college-educated labor from the Current Population Survey. Return to 9
- Autor et al. (1998) show that computer-intensive industries also raised their share of college labor. Krusell et al. (2000) show that capital equipment, as opposed to structures, have tended to raise the relative efficiency of college-educated labor. Return to 10
Suggested Citation
Cline, Alexander, and Barış Kaymak. 2025. “Demand for College Labor in the 21st Century.” Federal Reserve Bank of Cleveland, Economic Commentary 2025-04. https://doi.org/10.26509/frbc-ec-202504
This work by Federal Reserve Bank of Cleveland is licensed under Creative Commons Attribution-NonCommercial 4.0 International


- Share
About Us
The Federal Reserve Bank of Cleveland (commonly known as the Cleveland Fed) is part of the Federal Reserve System, the central bank of the United States.